Skip to content
New issue

Have a question about this project? Sign up for a free GitHub account to open an issue and contact its maintainers and the community.

By clicking “Sign up for GitHub”, you agree to our terms of service and privacy statement. We’ll occasionally send you account related emails.

Already on GitHub? Sign in to your account

runtime: dead Gs cause span fragmentation #9869

Open
randall77 opened this issue Feb 13, 2015 · 20 comments
Open

runtime: dead Gs cause span fragmentation #9869

randall77 opened this issue Feb 13, 2015 · 20 comments
Labels
compiler/runtime Issues related to the Go compiler and/or runtime.
Milestone

Comments

@randall77
Copy link
Contributor

Once we allocate a G, it is allocated forever. We have no mechanism to free them.
We should free dead Gs if they sit in the global free queue for long enough. Or maybe free all of them at each GC?

I noticed this while debugging #8832. The stacks for dead Gs are freed at GC time. This leads to a fragmented heap because spans for G storage and stack storage alternate in the heap. When only the stacks are freed, the resulting free spans won't coalesce because the spans for storing the Gs aren't freed.

@randall77
Copy link
Contributor Author

@dvyukov

@ianlancetaylor ianlancetaylor changed the title Free dead Gs runtime: Free dead Gs Feb 13, 2015
@bradfitz bradfitz added this to the Go1.5Maybe milestone Feb 24, 2015
@randall77 randall77 modified the milestones: Go1.6, Go1.5Maybe Jun 25, 2015
@rsc
Copy link
Contributor

rsc commented Oct 16, 2015

Rephrased as "dead Gs cause span fragmentation". It's not clear we can easily free dead G's - it's hard to be sure all the pointers to them have been found. I expect there is code in the runtime that depends on G's never being freed (reused to hold other types of data). I don't want to debug that.

How big a problem is the fragmentation?

@rsc rsc changed the title runtime: Free dead Gs runtime: dead Gs cause span fragmentation Oct 16, 2015
@randall77
Copy link
Contributor Author

The fragmentation can be pretty bad, the case in #8832 makes the heap into a repeated pattern of one page allocated (for Gs) and eight pages free (once used for stacks). So although the heap is ~90% free, we'd have to grow the heap for any large allocation.

That said, I don't think it is terribly common to use lots of Gs for a while and then never use them again.

I agree this may be hard. But it is something to think about if we can find a way.

@prashantv
Copy link
Contributor

That said, I don't think it is terribly common to use lots of Gs for a while and then never use them again.

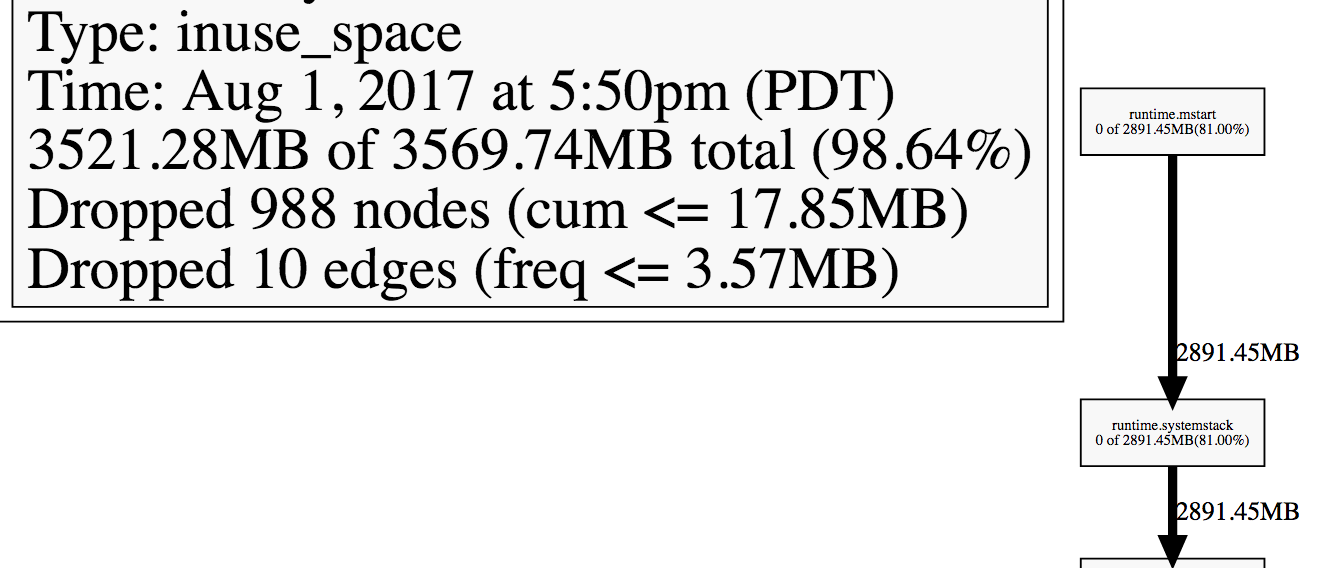
Most network servers tend to create a new goroutine per incoming request (E.g., the HTTP server). If there's a sudden huge spike in requests (often not intentional, but due to a misbehaving external service), it can cause a huge number of goroutines to be created, and even after the requests have been served, the process consumes a huge amount of memory. I'm assuming this is due to the fragmentation described in this issue.

As an example, we saw one process in production with a system usage of > 100GB, while the Go runtime thought it was using < 4GB.

Pprof output:
image

ps output:
image

@mandarjog
Copy link

I am seeing a similar issue I think. runtime.malg is the most prolific. It is possible that this is in response to a sudden influx of requests.

profile002

@randall77
Copy link
Contributor Author

@mandarjog : Why do you think this is related to fragmentation?
malg allocates goroutine stacks. Maybe you just have a lot of goroutines and thus lots of stack.

This issue is about what happens after all those goroutines complete. The syndrome I would expect to see is that the heap is mostly unused, including having little memory used by stacks, but large allocations still grow the heap.

@mandarjog
Copy link

After the go routines are done, I expect the usage to come down.
Should we expect the amount active set of 'G' to be at the high watermark of go routines?

https://user-images.githubusercontent.com/18554027/31787111-a33ae35e-b4d8-11e7-9cf1-2410427c1473.png

We see here that externally measured memory comes back down, but does not go all the way down.
I am not certain that fragmentation is the issue, but it is possible.

@randall77
Copy link
Contributor Author

Once a G is allocated, it is never freed, so yes the number of Gs at any point is the high water mark of the execution so far.
But, that's only for the G descriptor itself. That does not include a G's stack. Stacks of finished Gs are freed during garbage collection, so that space should not remain at the high water mark.
Stacks are 90%+ of the space used for a goroutine, so I don't think that can account for your graph - you're retaining at least 30% of the high water mark.

This issue is unlikely to affect the amount of memory used as reported by the OS. The fragmentation described in this issue is only for virtual addresses - all the holes described here can (and are) given back to the OS by the scavenger. (Unless you're running on an OS where the page size is >8K).

If you'd like to continue investigating, please open a new issue.

@robarchibald
Copy link

robarchibald commented Oct 25, 2017

I'm seeing this issue in an application I wrote as well. It is an HTTP server which essentially kicks off a specialized background web crawler. A "scan" request comes to the http server which throws the crawler into a goroutine and responds to the http request with "scan started successfully". Unfortunately, once it allocates memory, it never releases it no matter how long I wait. I wrote a simple program to show what is happening below. I posted on golang-nuts and was led here. Below is my post in its entirety. For me, this is a showstopper issue. If Go won't release memory from a very simple goroutine and it takes up gigs of memory (on my production app), I'll have to rewrite using something else.

Golang-nuts post:
I've got a nasty memory leak. It appears that Go won't reclaim memory when goroutines are called in a highly parallel fashion.

To illustrate the issue I've written a simple example below. When I run this on my Windows system, I get 800MB to 1 GB of memory consumption.

What's fascinating is that if I change the time.Sleep to 100 milliseconds instead of 1, the process never goes above 6 MB of memory. This is what I would expect since there are no objects here that should be retained in memory. And, it doesn't matter how long I wait, the garbage collector never cleans up the mess either.

I've tried to profile it using pprof and it didn't help me. It helped me find and fix other issues, but not this. It's entirely possible I did it wrong though since I am new to using that tool.

Help! Thanks in advance!

package main

import (
  "bytes"
  "fmt"
  "io/ioutil"
  "math/rand"
  "runtime"
  "time"
)

func main() {
  for i := 0; i < 1000; i++ {
    time.Sleep(time.Millisecond * 1)
    go fakeGetAndSaveData()
  }
  runtime.GC()
  time.Sleep(10 * time.Minute)
}

func fakeGetAndSaveData() {
  var buf bytes.Buffer
  for i := 0; i < 40000; i++ {
    buf.WriteString(fmt.Sprintf("the number is %d\n", i))
  }

  ioutil.WriteFile(fmt.Sprintf("%d.txt", rand.Int()), buf.Bytes(), 0644)
}

@randall77
Copy link
Contributor Author

@robarchibald I'm pretty sure what you are seeing is not related to this issue. Please open a new one. The reason I'm pretty sure is that the space used is all for bytes.Buffer, it isn't for the goroutine descriptors or their stacks. Even if we retained the descriptors and their stacks, it is only ~8MB (stacks on Windows are 8K to start).

How are you measuring the memory used by the process? The Go runtime should give all the unused memory back to the OS after 5 minutes. Although I admit I'm unsure how this is handled on Windows.

The difference between a 1ms sleep and a 100ms sleep is probably that in the latter, the each goroutine finishes before the next one is generated, so there is only one goroutine at a time. In the former, there are lots of goroutines simultaneously, each one using almost 1MB for its buffer.

@6degreeshealth
Copy link

Thanks @randall77. I'm measuring memory using the OS. The results are the same whether in Ubuntu 16.04 (production) or Windows 10 (my dev box). And, I specifically set the time.Sleep to 10 minutes because I know that Garbage collection is supposed to cleanup after 5 minutes. Plus, I explicitly call runtime.GC() immediately in case I could get it to collect the trash earlier. No dice either way. Go never releases the memory even after waiting a week. Sorry, I wasn't patient enough to wait longer than that. :)

I can certainly open a new issue, but this isn't an issue with bytes.Buffer. This is a problem with goroutine cleanup. Sure, this particular issue was opened because the descriptor and stack wasn't cleaned up, but I think I'm showing here that the issue is MUCH bigger than that. Nothing is getting cleaned up if the system is busy enough or if the parallelism is high enough... at least that's what I'm assuming here since I can change the delay to be longer and the problem goes away.

It isn't a bytes.Buffer issue. It isn't an ioutil.WriteFile issue. I only used bytes.Buffer for this example and that's not what I'm using in my real application. And, I can do a fmt.Println instead of ioutil.WriteFile and it still does the same thing too. As @prashantv mentioned, he's seen 100 GB of memory usage due to what sounds like a similar issue to mine.

@ianlancetaylor
Copy link
Contributor

@6degreeshealth Show us exactly how you are measuring memory. Ideally on Ubuntu. Don't use words to tell us what you are doing, show us the exact commands that you are using, and the exact output that you see. Thanks.

@6degreeshealth
Copy link

On Linux, I'm using top -b | grep memoryLeak command and on Windows, I use Task Manager. I just ran this again on Ubuntu 16.04 and it looks like it isn't exhibiting the problem after all. When I ran it yesterday it crashed my VM, but it wasn't due to out of memory as I'd assumed. But, I do see the problem clearly on Windows. Sorry, I'll put together a different example for Linux.

Here's what I see on Windows. This is after it's gone idle. Nothing new is being spawned. It's just sitting there. It stays like this for 10 minutes until the program closes.

image

@randall77
Copy link
Contributor Author

I've opened #22439 to discuss @6degreeshealth 's issues.
Let's leave this bug for G fragmentation issues.

@prashanthjbabu
Copy link

I'm seeing a similar problem with a golang program . The program spawns a good number of goroutines throughout the day . I've noticed a 200mb increase in memory hold at the end of the day. pprof heap returns :

Showing nodes accounting for 189.55MB, 85.32% of 222.16MB total
Dropped 41 nodes (cum <= 1.11MB)
Showing top 10 nodes out of 89
flat flat% sum% cum cum%
93.53MB 42.10% 42.10% 93.53MB 42.10% runtime.malg

200mb pileup on a daily basis is a huge amount . Is there any update on this issue ? Any possible workarounds?

@randall77
Copy link
Contributor Author

@prashanthjbabu
The fact that malg is the culprit means it probably isn't this issue.
This issue is about fragmentation after the goroutine stacks are freed. You're seeing goroutine stacks that haven't been freed yet (malg allocates goroutine stacks).
Could you open a new issue, ideally with code to reproduce the problem?

@prashanthjbabu
Copy link

@randall77
Thanks for your response ! I ended up in this issue while looking at #16022 which also talks about malg holding up too much memory. In my case too malg is holding up memory . So I thought my issue is similar to #16022 and since that issue was pointing to this one I thought I'd post here.

@randall77
Copy link
Contributor Author

@prashanthjbabu I guess it is possible your stacks are being freed, and the space use you're seeing is just G descriptors. That would take close to 1 million goroutines. Do you have that many goroutines live at once? Or perhaps you have a goroutine leak?
It could also be a bug in the runtime that leaks descriptors. To track such a thing down, we'd need code to reproduce your bug.

@prashanthjbabu
Copy link

@randall77
Thanks for your response ! After you mentioned the possibilities I ran the pprof goroutine profile and realized that there was indeed a goroutine leak like you mentioned . Thanks for the help!

@ep4sh
Copy link

ep4sh commented Apr 4, 2022

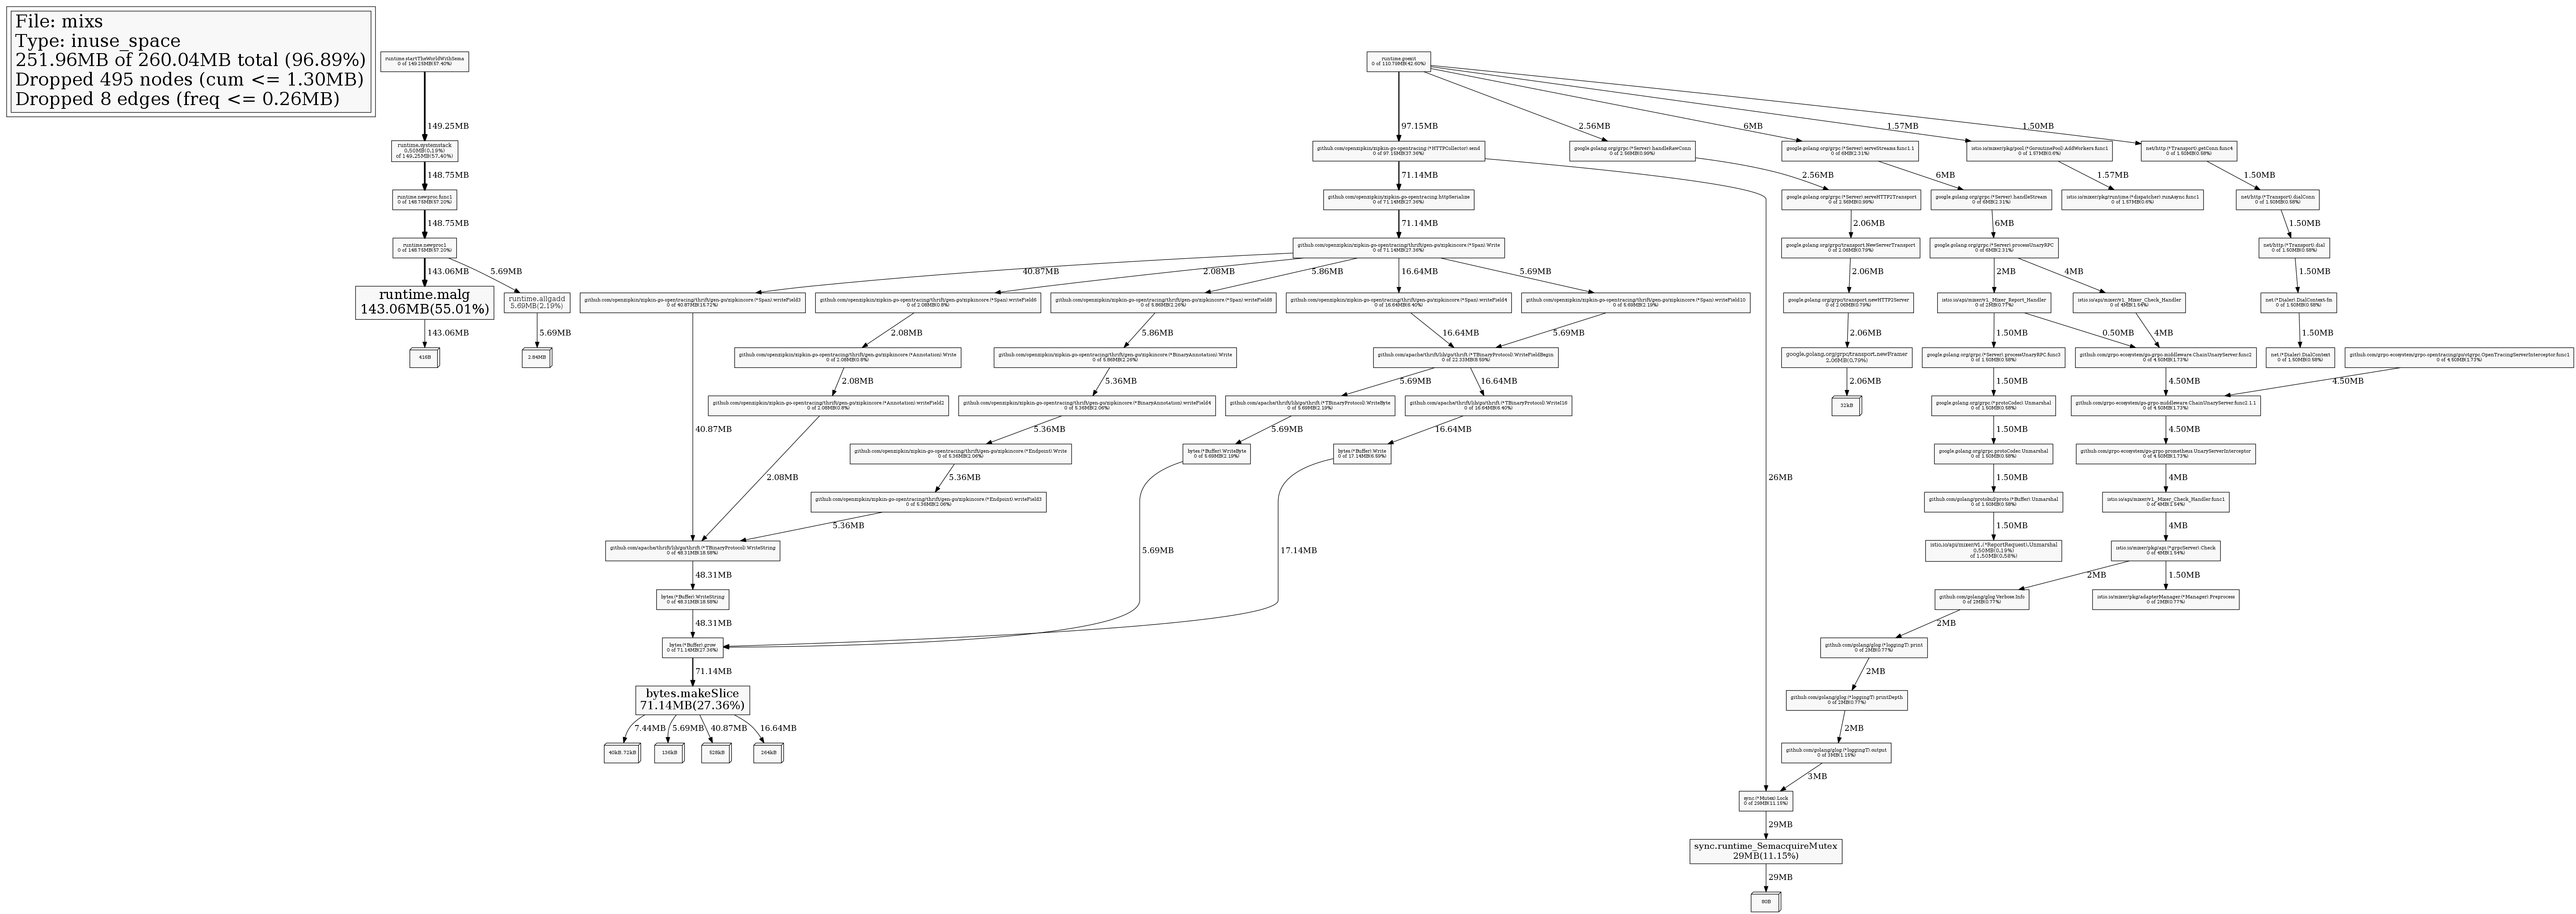
I think I have the similar picture in my go web app:

kubectl top pod myapp-5f9f6bb846-tfnvz --containers                                                                             

POD                         NAME          CPU(cores)   MEMORY(bytes)
myapp-5f9f6bb846-tfnvz   repolite      2m           1543Mi

Maybe I am wrong, but I don't see anything strange:

 ~ curl "http://<HOST>/debug/pprof/goroutine?debug=1"
goroutine profile: total 4
1 @ 0x439b36 0x432253 0x464fa9 0x4ca172 0x4cb4da 0x4cb4c8 0x58aca9 0x597965 0x66386d 0x54e3c3 0x54e51d 0x669396 0x46a4e1
#	0x464fa8	internal/poll.runtime_pollWait+0x88		/usr/local/go/src/runtime/netpoll.go:234
#	0x4ca171	internal/poll.(*pollDesc).wait+0x31		/usr/local/go/src/internal/poll/fd_poll_runtime.go:84
#	0x4cb4d9	internal/poll.(*pollDesc).waitRead+0x259	/usr/local/go/src/internal/poll/fd_poll_runtime.go:89
#	0x4cb4c7	internal/poll.(*FD).Read+0x247			/usr/local/go/src/internal/poll/fd_unix.go:167
#	0x58aca8	net.(*netFD).Read+0x28				/usr/local/go/src/net/fd_posix.go:56
#	0x597964	net.(*conn).Read+0x44				/usr/local/go/src/net/net.go:183
#	0x66386c	net/http.(*connReader).Read+0x16c		/usr/local/go/src/net/http/server.go:780
#	0x54e3c2	bufio.(*Reader).fill+0x102			/usr/local/go/src/bufio/bufio.go:101
#	0x54e51c	bufio.(*Reader).Peek+0x5c			/usr/local/go/src/bufio/bufio.go:139
#	0x669395	net/http.(*conn).serve+0xc35			/usr/local/go/src/net/http/server.go:1955

1 @ 0x439b36 0x432253 0x464fa9 0x4ca172 0x4cd4cc 0x4cd4b9 0x58c455 0x5a09e8 0x59fbbd 0x66e134 0x66dd5d 0x82a669 0x834885 0x439767 0x46a4e1
#	0x464fa8	internal/poll.runtime_pollWait+0x88		/usr/local/go/src/runtime/netpoll.go:234
#	0x4ca171	internal/poll.(*pollDesc).wait+0x31		/usr/local/go/src/internal/poll/fd_poll_runtime.go:84
#	0x4cd4cb	internal/poll.(*pollDesc).waitRead+0x22b	/usr/local/go/src/internal/poll/fd_poll_runtime.go:89
#	0x4cd4b8	internal/poll.(*FD).Accept+0x218		/usr/local/go/src/internal/poll/fd_unix.go:402
#	0x58c454	net.(*netFD).accept+0x34			/usr/local/go/src/net/fd_unix.go:173
#	0x5a09e7	net.(*TCPListener).accept+0x27			/usr/local/go/src/net/tcpsock_posix.go:140
#	0x59fbbc	net.(*TCPListener).Accept+0x3c			/usr/local/go/src/net/tcpsock.go:262
#	0x66e133	net/http.(*Server).Serve+0x393			/usr/local/go/src/net/http/server.go:3002
#	0x66dd5c	net/http.(*Server).ListenAndServe+0x7c		/usr/local/go/src/net/http/server.go:2931
#	0x82a668	repolite2/internal/api.Run+0x828		/build/internal/api/api.go:101
#	0x834884	main.main+0x1e4					/build/main.go:46
#	0x439766	runtime.main+0x226				/usr/local/go/src/runtime/proc.go:255

1 @ 0x464ac5 0x6bdfd5 0x6bdded 0x6baf6b 0x6c9b7a 0x6ca72e 0x66a18f 0x66bf49 0x82a88c 0x66a18f 0x66dbbb 0x669268 0x46a4e1
#	0x464ac4	runtime/pprof.runtime_goroutineProfileWithLabels+0x24	/usr/local/go/src/runtime/mprof.go:746
#	0x6bdfd4	runtime/pprof.writeRuntimeProfile+0xb4			/usr/local/go/src/runtime/pprof/pprof.go:724
#	0x6bddec	runtime/pprof.writeGoroutine+0x4c			/usr/local/go/src/runtime/pprof/pprof.go:684
#	0x6baf6a	runtime/pprof.(*Profile).WriteTo+0x14a			/usr/local/go/src/runtime/pprof/pprof.go:331
#	0x6c9b79	net/http/pprof.handler.ServeHTTP+0x499			/usr/local/go/src/net/http/pprof/pprof.go:253
#	0x6ca72d	net/http/pprof.Index+0x12d				/usr/local/go/src/net/http/pprof/pprof.go:371
#	0x66a18e	net/http.HandlerFunc.ServeHTTP+0x2e			/usr/local/go/src/net/http/server.go:2047
#	0x66bf48	net/http.(*ServeMux).ServeHTTP+0x148			/usr/local/go/src/net/http/server.go:2425
#	0x82a88b	repolite2/internal/api.loggingMiddleware.func1+0x6b	/build/internal/api/api.go:111
#	0x66a18e	net/http.HandlerFunc.ServeHTTP+0x2e			/usr/local/go/src/net/http/server.go:2047
#	0x66dbba	net/http.serverHandler.ServeHTTP+0x43a			/usr/local/go/src/net/http/server.go:2879
#	0x669267	net/http.(*conn).serve+0xb07				/usr/local/go/src/net/http/server.go:1930

1 @ 0x4b2c25 0x4b096d 0x4cb505 0x4cb4ed 0x4cb2a5 0x58aca9 0x597965 0x6633bf 0x46a4e1
#	0x4b2c24	syscall.Syscall+0x4				/usr/local/go/src/syscall/asm_linux_amd64.s:20
#	0x4b096c	syscall.read+0x4c				/usr/local/go/src/syscall/zsyscall_linux_amd64.go:687
#	0x4cb504	syscall.Read+0x284				/usr/local/go/src/syscall/syscall_unix.go:189
#	0x4cb4ec	internal/poll.ignoringEINTRIO+0x26c		/usr/local/go/src/internal/poll/fd_unix.go:582
#	0x4cb2a4	internal/poll.(*FD).Read+0x24			/usr/local/go/src/internal/poll/fd_unix.go:163
#	0x58aca8	net.(*netFD).Read+0x28				/usr/local/go/src/net/fd_posix.go:56
#	0x597964	net.(*conn).Read+0x44				/usr/local/go/src/net/net.go:183
#	0x6633be	net/http.(*connReader).backgroundRead+0x3e	/usr/local/go/src/net/http/server.go:672

My pprof inuse_space report:

go tool pprof -png http://<host>/debug/pprof/heap

image

The "curious" thing that I don't see, which process consumes 1.5Gb...

I've added another handler with debug.FreeOSMemory():

func freeHandler() http.Handler {
	return http.HandlerFunc(func(w http.ResponseWriter, r *http.Request) {
		debug.FreeOSMemory()

		w.WriteHeader(http.StatusOK)
		w.Header().Set("Content-Type", "application/text")
		w.Write([]byte("memfree"))

	})
}

But triggering the handler makes no effect. I have been waiting for several days, but my memory wasn't returned to OS.
I'm using Go 1.17.8
still wondering which entry consumes 1.5 Gb of memory..

Appreciate any suggestion how to release the memory :)

@gopherbot gopherbot added the compiler/runtime Issues related to the Go compiler and/or runtime. label Jul 7, 2022
Sign up for free to join this conversation on GitHub. Already have an account? Sign in to comment
Labels
compiler/runtime Issues related to the Go compiler and/or runtime.
Projects
None yet
Development

No branches or pull requests

10 participants