Skip to content
New issue

Have a question about this project? Sign up for a free GitHub account to open an issue and contact its maintainers and the community.

By clicking “Sign up for GitHub”, you agree to our terms of service and privacy statement. We’ll occasionally send you account related emails.

Already on GitHub? Sign in to your account

cmd/pprof: macOS 12.6.1 profile overcounts system calls (again) #57722

Open
felixge opened this issue Jan 10, 2023 · 14 comments
Open

cmd/pprof: macOS 12.6.1 profile overcounts system calls (again) #57722

felixge opened this issue Jan 10, 2023 · 14 comments
Assignees
Labels
compiler/runtime Issues related to the Go compiler and/or runtime. NeedsInvestigation Someone must examine and confirm this is a valid issue and not a duplicate of an existing one. OS-Darwin
Milestone

Comments

@felixge
Copy link
Contributor

felixge commented Jan 10, 2023

What version of Go are you using (go version)?

$ go version
go version go1.19.4 darwin/arm64

This is on macOS 12.6.1 with an M1 chip, but the problem seems to affect Intel as well.

Does this issue reproduce with the latest release?

Yes.

What operating system and processor architecture are you using (go env)?

go env Output
$ go env
GO111MODULE="auto"
GOARCH="arm64"
GOBIN=""
GOCACHE="/Users/MyUser/Library/Caches/go-build"
GOENV="/Users/MyUser/Library/Application Support/go/env"
GOEXE=""
GOEXPERIMENT=""
GOFLAGS="-count=1"
GOHOSTARCH="arm64"
GOHOSTOS="darwin"
GOINSECURE=""
GOMODCACHE="/Users/MyUser/go/pkg/mod"
GONOPROXY="github.com/MyOrg"
GONOSUMDB="github.com/MyOrg,go.myorg.io"
GOOS="darwin"
GOPATH="/Users/MyUser/go"
GOPRIVATE="github.com/MyOrg"
GOPROXY="binaries.myorg.io,https://proxy.golang.org,direct"
GOROOT="/opt/homebrew/Cellar/go/1.19.4/libexec"
GOSUMDB="sum.golang.org"
GOTMPDIR=""
GOTOOLDIR="/opt/homebrew/Cellar/go/1.19.4/libexec/pkg/tool/darwin_arm64"
GOVCS=""
GOVERSION="go1.19.4"
GCCGO="gccgo"
AR="ar"
CC="clang"
CXX="clang++"
CGO_ENABLED="1"
GOMOD="/Users/MyUser/go/src/github.com/felixge/macos-profiler-bias/go.mod"
GOWORK=""
CGO_CFLAGS="-g -O2"
CGO_CPPFLAGS=""
CGO_CXXFLAGS="-g -O2"
CGO_FFLAGS="-g -O2"
CGO_LDFLAGS="-g -O2"
PKG_CONFIG="pkg-config"
GOGCCFLAGS="-fPIC -arch arm64 -pthread -fno-caret-diagnostics -Qunused-arguments -fmessage-length=0 -fdebug-prefix-map=/var/folders/0t/nwrdnfnd2mjdgr0z_p_f6xww0000gq/T/go-build3012663781=/tmp/go-build -gno-record-gcc-switches -fno-common"

What did you do?

Create a CPU profile of a CPU-bound workload that is interleaved with short system calls.

For example TestInterleavedIO is a reproducer that is compressing a 250MB file containing random data.

What did you expect to see?

A profile that is similar to the one shown below for linux. Most of time should be spent on gzip compression, and a little bit on syscalls.

interleaved linux

What did you see instead?

On macOS the majority of time is attributed to read and write syscalls. The gzip compression is barely showing up at all.

interleaved darwin

Sanity Check

TestSequentialIO implements the same workload, but instead of interleaved I/O, it does one big read first, followed by gzip compression, followed by a big write.

As expected, Linux produces a profile dominated by gzip compression.

sequential linux pprof

And macOS now shows the right profile too.

sequential darwin pprof

Conclusion

macOS setitimer(2) seems to bias towards syscalls. This issue was reported and fixed in the past, see #17406 (2016) and #6047 (2013). So this could be a macOS regression.

I've uploaded all code, pprofs and screenshots to this google drive folder.

@gopherbot gopherbot added the compiler/runtime Issues related to the Go compiler and/or runtime. label Jan 10, 2023
@cbedard
Copy link
Contributor

cbedard commented Jan 10, 2023

Testing on an Intel MacOS (MacOS 12.6.1)

go version

go version
go version go1.19.4 darwin/amd64

go env

go env
GO111MODULE=""
GOARCH="amd64"
GOBIN=""
GOCACHE="/Users/cameron.bedard/Library/Caches/go-build"
GOENV="/Users/cameron.bedard/Library/Application Support/go/env"
GOEXE=""
GOEXPERIMENT=""
GOFLAGS=""
GOHOSTARCH="amd64"
GOHOSTOS="darwin"
GOINSECURE=""
GOMODCACHE="/Users/cameron.bedard/go/pkg/mod"
GONOPROXY=""
GONOSUMDB=""
GOOS="darwin"
GOPATH="/Users/cameron.bedard/go"
GOPRIVATE=""
GOPROXY="https://proxy.golang.org,direct"
GOROOT="/usr/local/go"
GOSUMDB="sum.golang.org"
GOTMPDIR=""
GOTOOLDIR="/usr/local/go/pkg/tool/darwin_amd64"
GOVCS=""
GOVERSION="go1.19.4"
GCCGO="gccgo"
GOAMD64="v1"
AR="ar"
CC="clang"
CXX="clang++"
CGO_ENABLED="1"
GOMOD="/dev/null"
GOWORK=""
CGO_CFLAGS="-g -O2"
CGO_CPPFLAGS=""
CGO_CXXFLAGS="-g -O2"
CGO_FFLAGS="-g -O2"
CGO_LDFLAGS="-g -O2"
PKG_CONFIG="pkg-config"
GOGCCFLAGS="-fPIC -arch x86_64 -m64 -pthread -fno-caret-diagnostics -Qunused-arguments -fmessage-length=0 -fdebug-prefix-map=/var/folders/zs/r6mt7f1n66n9mw2rz8f9w2540000gp/T/go-build1170536968=/tmp/go-build -gno-record-gcc-switches -fno-common"

I'm a bit of a go noob (start during advent of code lol), so I wasn't able to set up the UI you used but my IDE's built in pprof output looks similar to yours. If you want the matching profiler UI and send me a how-to link I can set it up :)

TestInterleavedIO
Screen Shot 2023-01-10 at 2 34 40 PM

TestSequentialIO
Screen Shot 2023-01-10 at 2 35 13 PM

@felixge
Copy link
Contributor Author

felixge commented Jan 10, 2023

@cbedard thanks, this looks like Intel Macs have the same issue. The UI doesn't matter, this is fine :).

@felixge felixge changed the title cmd/pprof: macOS 12.6.1 (M1) profile overcounts system calls (again) cmd/pprof: macOS 12.6.1 profile overcounts system calls (again) Jan 10, 2023
@cagedmantis cagedmantis added the NeedsInvestigation Someone must examine and confirm this is a valid issue and not a duplicate of an existing one. label Jan 11, 2023
@cagedmantis
Copy link
Contributor

@golang/runtime

@prattmic
Copy link
Member

prattmic commented Jan 11, 2023

It would not surprise me if darwin has unfair SIGPROF delivery. e.g., if the system call return path updates the CPU timers, it may be more likely to trigger overflow and deliver SIGPROF to itself vs threads that do not make system calls.

@prattmic
Copy link
Member

I think this could be tested with a simple C program. Two threads, one running a busy loop, the other with a busy loop that makes a system call. Do they both receive ~50% of SIGPROF signals?

@cherrymui
Copy link
Member

I haven't read the sample code. Just wonder, for the "interleaved" case, are the compression and I/O running concurrently on different goroutines/threads, or they are on the same thread but just interleaved? If the latter, do you know what frequency or time period the interleaving is, and is it faster than the profile sampling frequency (100 Hz)? Thanks.

@felixge
Copy link
Contributor Author

felixge commented Jan 11, 2023

I haven't read the sample code. Just wonder, for the "interleaved" case, are the compression and I/O running concurrently on different goroutines/threads, or they are on the same thread but just interleaved?

It's the latter. But I suspect that there could be concurrent/parallel read-ahead happening on the OS level.

If the latter, do you know what frequency or time period the interleaving is, and is it faster than the profile sampling frequency (100 Hz)? Thanks.

According to the trace (shown below), the workload issues 53k syscalls in 3.7s, so at ~14kHz it's much faster than the profiling frequency.

CleanShot 2023-01-11 at 22 37 34@2x

It would not surprise me if darwin has unfair SIGPROF delivery. e.g., if the system call return path updates the CPU timers, it may be more likely to trigger overflow and deliver SIGPROF to itself vs threads that do not make system calls.
I think this could be tested with a simple C program. Two threads, one running a busy loop, the other with a busy loop that makes a system call. Do they both receive ~50% of SIGPROF signals?

What syscall would you use? It would have to be a non-blocking one to see 50%? But yeah, a small C reproducer could be useful for this.

@prattmic
Copy link
Member

prattmic commented Jan 18, 2023

I'd start with getpid or something similar, though perhaps it needs to go through the scheduler, so a very briefly blocking system call may be needed.

@mknyszek
Copy link
Contributor

In triage now, since it seems like the next step is a C reproducer to confirm unfair SIGPROF delivery? Does that sound right? (The assignee is mostly just for tracking, there's no obligation; feel free to remove it.)

@adonovan
Copy link
Member

I tried to reproduce the problem in C with this program, but no luck. The compute thread gets around 1200 ticks each of 1ms CPU (which is a huge underestimate since /usr/bin/time reports 6.1s of user CPU), but the main thread gets 0 ticks unless I increase the argument to fib().

Any suggestions?

@cherrymui
Copy link
Member

cherrymui commented Dec 13, 2023

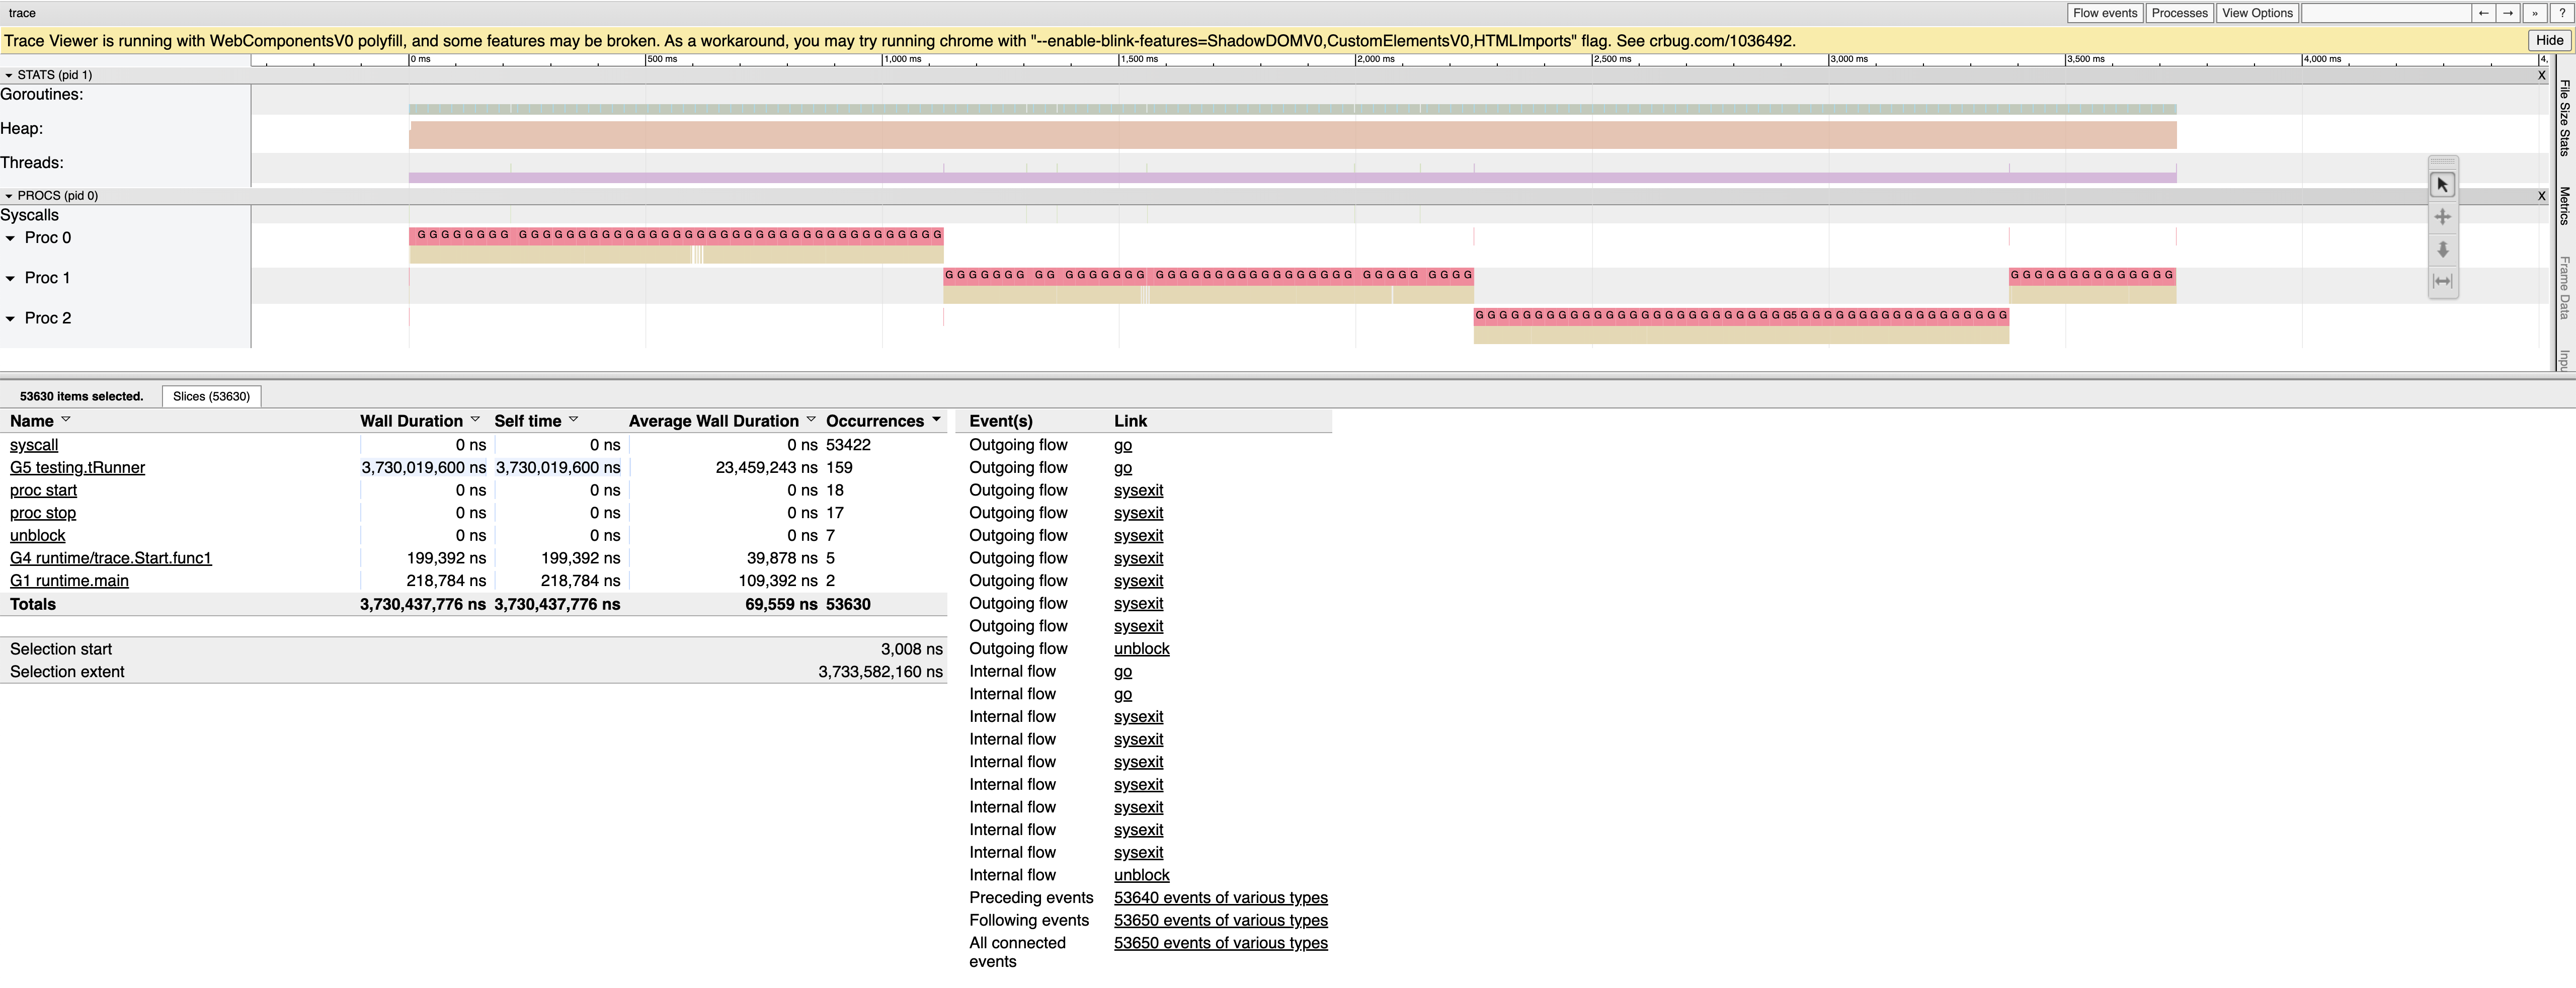
I spent some time look into this. I ran the original Go reproducer with both profiling and tracing turned on, and saw that while the syscalls and compression are interleaved, the profiling samples indeed mostly land on syscalls.

image

This is a (small portion of a) trace with InterleavedIO. The yellow bars on the second row are syscalls, which occupy a small fraction of the time. The pink/magenta bars are profiling samples. They are ~10 ms apart (as expected with 100 Hz profiling rate), but mostly land on syscalls, with many of them land at the end of syscalls, but not always (some land in the middle, and the syscall restarts). So clearly there is a bias.

Interestingly, there seems also some bias with SequentialIO.

image

This is a (total) trace of SequentialIO. The yellow blocks are syscalls (open, read, write), which takes about ~500 ms in total, or nearly ~10% of the total time. But in the profile there is very few samples on syscalls, much less than 10%. Zooming in the trace for the last syscall

image

The pink/magenta bars are profiling samples. There is a train of samples before the syscall, and then when the syscall starts, it gets exactly 1 sample. The syscall last much longer, but there is no more sample land on that syscall. So while for the interleaved case syscalls are over-sampled, for long running syscall, it is under-sampled (!).

(To rule out other possibilities, I also turned off async preemption, in case that the preemption signal interrupts syscalls or affects profiling signal delivery, but it doesn't make a difference. To make sure the runtime is doing the right accounting, I printed signal PCs and it is indeed that most of them landed in libc address range.)

C reproducer

Inspired by the interleaved IO and Alan's C program, I wrote this C program https://go.dev/play/p/x3zK__wMKly , which does interleaved (short) read syscall and (long) computation. On my machine it prints

fib pc 0x10213cb10, etext 0x102141000
read 183741000 ns (7.894187%), fib 2142026000 ns (92.029294%)
sys 1970 samples, fib 98 samples, other 0 samples

That is, read is ~8% of total time, fib (computation) is 92% of total time, whereas most of the profiling samples land in syscalls (or at least, libc functions). So there is a strong bias.

I also used the macOS builtin sample program to take a "sample profile", which shows

Sort by top of stack, same collapsed (when >= 5):
        fib  (in a.out)        1636
        read  (in libsystem_kernel.dylib)        149
        _sigtramp  (in libsystem_platform.dylib)        23

Most sample land in fib, as expected. This suggests that the kernel is capable of doing the sampling and accounting correctly, but somehow it doesn't deliver the profiling signals in a way that we expect...

@cherrymui
Copy link
Member

For the long syscall, if it is mostly IO and the kernel counts only CPU time for profiling timers, the under-sampling may be okay.

For the short ones, maybe the kernel is more likely to update its accounting at syscalls and only then find that it should trigger a profiling timer and deliver the signal...

@FiloSottile
Copy link
Contributor

Not sure a +1 is useful here, but this is still true in macOS 14.2.1 (23C71) and very visible in anything that calls crypto/rand.Read, making it appear as if all the time was spent on unix.GetEntropy.

@gopherbot gopherbot modified the milestones: Go1.22, Go1.23 Feb 6, 2024
@felixge
Copy link
Contributor Author

felixge commented Mar 12, 2024

also used the macOS builtin sample program to take a "sample profile", which shows [...]
This suggests that the kernel is capable of doing the sampling and accounting correctly, but somehow it doesn't deliver the profiling signals in a way that we expect...

I recently looked into how the sample program (and it's big brother spindump) works, and as far as I can tell, it's a wall clock profiler. I.e. it takes stack traces of all threads on a fixed interval, and there is no attempt to account for CPU time. However, it does record the thread state (On-CPU vs Off-CPU) when it takes samples, so filtering the resulting profile by samples that were On-CPU should yield a CPU profile.

Sign up for free to join this conversation on GitHub. Already have an account? Sign in to comment
Labels
compiler/runtime Issues related to the Go compiler and/or runtime. NeedsInvestigation Someone must examine and confirm this is a valid issue and not a duplicate of an existing one. OS-Darwin
Projects
Status: In Progress
Development

No branches or pull requests

9 participants