runtime/trace: execution trace doesn't include pprof labels #56295
Comments
|
Change https://go.dev/cl/446975 mentions this issue: |
|
Thanks. I think this is addition makes sense. How should these labels be surfaced in the current UI? |
|
I was picturing that the label event could be connected to every other event for the same G while the G had those labels. Ideally you'd then be able to search for events based on the labels. Possibly you'd also have an instantaneous event (like a CPU sample) for when the labels for a goroutine are changed. This seems possible in principle through references in the Chrome trace format. I've experimented a bit and have yet to find a good way to do that, though. It's not clear to me whether resolving references, as described in that doc, is supported in the trace UI. I've tried it, but it didn't work like I expected ( I also tried creating an async event for each time a set of labels is active for a goroutine. I can get something to show up in the UI as a span for the duration the labels existed. However, the span shows up above the row of events for the P where the event originated, even though the goroutine with those labels can move between Ps. I'm not too familiar with the trace UI, though, so there may be some obvious way to do what I'm picturing that I just don't know about :) We could also have a command-line option to filter the trace event stream by specific label sets before its read into the UI. Also, if we have labels in the event stream, the labels could also be added to the pprof profiles that are generated from the trace. |
+1 to both of these options for now. In the future Perfetto should be able to display and filter events based on labels in the UI if we go in that direction. But I haven't tested it. |
Goroutines can have key-value labels attached to them through the
runtime/pprof package. These labels are added to samples in the
goroutine and CPU profiles to provide additional context for what the
goroutines were doing when the samples were recorded. However, these
labels are currently not available in execution traces.

This CL adds an new event, traceEvGoroutineLabels, which includes a
goroutine ID and a sequence of key-value pairs from the label set which
was applied to that goroutine. This event is emitted when labels are
updated, and at the start of tracing to record labels that were present
before tracing began.

Fixes golang#56295.

Change-Id: I2ffdc6fcf76c7f714489361a3b3889833f6c311b
|
I've mailed https://go-review.googlesource.com/c/go/+/456239 to demonstrate adding pprof labels in a trace event stream to pprof profiles derived from the stream. You'll get profiles with the labels attached to samples, which you can see in the pprof graph UI like in the screenshot below from a trace-derived network latency profile. You can also filter by labels (a.k.a "tags") with options like I'm still working on a demonstration of filtering/focusing on events within the UI based on labels, but I'll mail something once I get a good solution. |

Both of these sound good to me as well.
Very cool! Slightly tangential, but it reminds me that I think eventually we're going to want to document these features at like, go.dev/doc/diagnostics (you don't need to do that now). I'll go scribble that down somewhere else... |
|
I've also mailed https://go-review.googlesource.com/c/go/+/460095 (marked WIP) to highlight events in the UI based on goroutine labels. Compared to adding labels to profiles derived from the trace, I think exploring the trace UI based on labels is much more open-ended. There are different use cases. One might be to scope in on a particular request, where the label of interest is a particular request ID, with a much more focused view similar to the task ID-oriented view:
Another would be to highlight all work related to a specific endpoint on a web app with multiple mostly-independent endpoints:
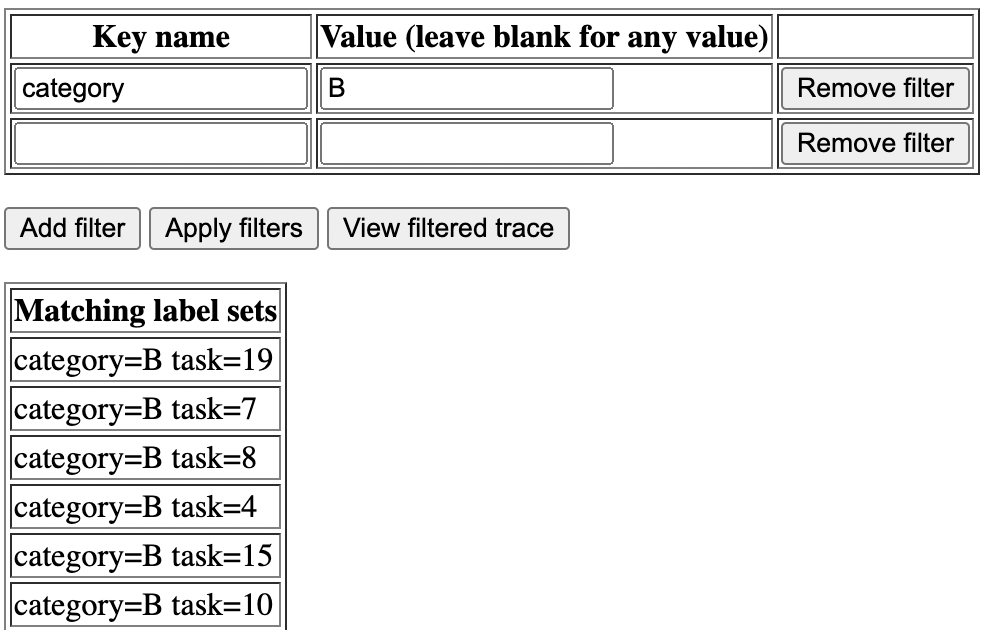
The CL I sent adds query parameters to the trace endpoint to specify label keys and values, and highlights events related to goroutines with those labels while greying out the others. I think you might want to still have other events visible but less emphasized. The CL doesn't add a way to filter the trace from the main page, though, just adds the query parameters for now. I've played with a page to build a list of label filters and then take you to the viewer with those filters:
It's pretty rough though, and how we do this probably deserves more discussion. |


Goroutines can have key-value labels attached to them through the
runtime/pprof package. These labels are added to samples in the
goroutine and CPU profiles to provide additional context for what the
goroutines were doing when the samples were recorded. However, these
labels are currently not available in execution traces.

This CL adds an new event, traceEvGoroutineLabels, which includes a
goroutine ID and a sequence of key-value pairs from the label set which
was applied to that goroutine. This event is emitted when labels are
updated, and at the start of tracing to record labels that were present
before tracing began.

Fixes golang#56295.

Change-Id: I2ffdc6fcf76c7f714489361a3b3889833f6c311b
|
Kicking to Backlog since this didn't make Go 1.21. Not punting to Go 1.22 since IIUC this has been deprioritized. It still would be nice to have this alignment between these diagnostic formats, but it doesn't seem urgent. Please comment if you plan to work on it for Go 1.22, and I'll move it to that milestone. Thanks! |
Labels set through
runtime/pprof.SetGoroutineLabelsdon't show up in execution traces. In the CPU and goroutine profiles, samples include the labels from the sampled goroutine. Labels are quite useful for associating CPU usage with trace span IDs, HTTP endpoints, user IDs, etc.It would be useful to have these labels in execution traces as well. For example, since execution traces now include timestamped CPU profile samples, trace events could be associated with an application-level trace span ID using labels to get a breakdown of on-CPU and off-CPU time for an individual request. We can further bridge runtime/pprof and runtime/trace by making labels, which are already available in some profiles, available in traces as well.
Arguably there's already support for something similar to this through
trace.WithRegionandtrace.NewTask. However, these values are one-dimensional and seem to be intended for breaking down a process into steps (read an event stream, query a database, etc...). To record additional contextual information, like a specific distributed trace ID or user ID, you'd need to do something ad-hoc like pack that information into the task name, or show it in a designatedtrace.Logcategory.Perhaps profile labels could be added to the trace as a new event that is emitted whenever the labels for a goroutine are updated? (See this comment)
See also #41554
The text was updated successfully, but these errors were encountered: