runtime: FreeBSD nanotime performance regression with different CPU setups #50947
Comments
|
#17712 may be somehow related to this. |
|
Your profiles show the three different cases of time source: 1CPU VirtualBox -> TSC I am not very familiar with FreeBSD timekeeping, but from my experience with Linux timekeeping your results match my expectations: using the TSC is most efficient, followed by userspace-accessible HPET, following by actually making a system call. Regarding how to handle this, for the HPET case the resolution should be in figuring out why this system is in HPET mode. There shouldn't be much reason for a hypervisor on a CPU as modern as you have to not support use of the TSC on SMP VMs. Either something in the hypervisor is disabling access to the TSC, or something in the FreeBSD kernel is deciding the TSC isn't reliable. For the DigitalOcean case, the first step is figuring out which clock mode the kernel is putting the VDSO in (perhaps print from the function linked above). I see that FreeBSD supports a few more modes including a KVM paravirtualized clock. If it is in one of those modes, perhaps our VDSO code needs to add support. |
|
Based on freebsd/freebsd-src@8cc15b0, it looks like FreeBSD doesn't trust the TSC on VirtualBox for some reason (N.B. |
|
I've got 1CPU VirtualBoxkern.timecounter.tsc_shift: 1 kern.timecounter.smp_tsc_adjust: 0 kern.timecounter.smp_tsc: 0 kern.timecounter.invariant_tsc: 1 kern.timecounter.fast_gettime: 1 kern.timecounter.tick: 1 kern.timecounter.choice: ACPI-fast(900) i8254(0) TSC-low(1000) dummy(-1000000) kern.timecounter.hardware: TSC-low kern.timecounter.alloweddeviation: 5 kern.timecounter.timehands_count: 2 kern.timecounter.stepwarnings: 0 kern.timecounter.tc.ACPI-fast.quality: 900 kern.timecounter.tc.ACPI-fast.frequency: 3579545 kern.timecounter.tc.ACPI-fast.counter: 295440892 kern.timecounter.tc.ACPI-fast.mask: 4294967295 kern.timecounter.tc.i8254.quality: 0 kern.timecounter.tc.i8254.frequency: 1193182 kern.timecounter.tc.i8254.counter: 50397 kern.timecounter.tc.i8254.mask: 65535 kern.timecounter.tc.TSC-low.quality: 1000 kern.timecounter.tc.TSC-low.frequency: 1296029345 kern.timecounter.tc.TSC-low.counter: 3889432018 kern.timecounter.tc.TSC-low.mask: 4294967295 2CPU VirtualBoxkern.timecounter.tsc_shift: 1 kern.timecounter.smp_tsc_adjust: 0 kern.timecounter.smp_tsc: 0 kern.timecounter.invariant_tsc: 1 kern.timecounter.fast_gettime: 1 kern.timecounter.tick: 1 kern.timecounter.choice: ACPI-fast(900) i8254(0) TSC-low(-100) dummy(-1000000) kern.timecounter.hardware: ACPI-fast kern.timecounter.alloweddeviation: 5 kern.timecounter.timehands_count: 2 kern.timecounter.stepwarnings: 0 kern.timecounter.tc.ACPI-fast.quality: 900 kern.timecounter.tc.ACPI-fast.frequency: 3579545 kern.timecounter.tc.ACPI-fast.counter: 3480961343 kern.timecounter.tc.ACPI-fast.mask: 4294967295 kern.timecounter.tc.i8254.quality: 0 kern.timecounter.tc.i8254.frequency: 1193182 kern.timecounter.tc.i8254.counter: 35839 kern.timecounter.tc.i8254.mask: 65535 kern.timecounter.tc.TSC-low.quality: -100 kern.timecounter.tc.TSC-low.frequency: 1296127369 kern.timecounter.tc.TSC-low.counter: 2127372050 kern.timecounter.tc.TSC-low.mask: 4294967295 1CPU DigitalOceankern.timecounter.tsc_shift: 1 kern.timecounter.smp_tsc_adjust: 0 kern.timecounter.smp_tsc: 0 kern.timecounter.invariant_tsc: 0 kern.timecounter.fast_gettime: 1 kern.timecounter.tick: 1 kern.timecounter.choice: i8254(0) ACPI-fast(900) HPET(950) TSC-low(800) dummy(-1000000) kern.timecounter.hardware: HPET kern.timecounter.alloweddeviation: 5 kern.timecounter.timehands_count: 2 kern.timecounter.stepwarnings: 0 kern.timecounter.tc.i8254.quality: 0 kern.timecounter.tc.i8254.frequency: 1193182 kern.timecounter.tc.i8254.counter: 43479 kern.timecounter.tc.i8254.mask: 65535 kern.timecounter.tc.ACPI-fast.quality: 900 kern.timecounter.tc.ACPI-fast.frequency: 3579545 kern.timecounter.tc.ACPI-fast.counter: 7730510 kern.timecounter.tc.ACPI-fast.mask: 16777215 kern.timecounter.tc.HPET.quality: 950 kern.timecounter.tc.HPET.frequency: 100000000 kern.timecounter.tc.HPET.counter: 2395020808 kern.timecounter.tc.HPET.mask: 4294967295 kern.timecounter.tc.TSC-low.quality: 800 kern.timecounter.tc.TSC-low.frequency: 1247085954 kern.timecounter.tc.TSC-low.counter: 3806080953 kern.timecounter.tc.TSC-low.mask: 4294967295 |
|
Oops, this makes me realized I swapped VirtualBox and DigitalOcean. The VB profile shows fallback to syscall, while DigitalOcean shows use of HPET. |
|
Summary of what I see from that: 1CPU VirtualBox: TSC is fine. I don't think there is a lot for Go to do here. For VirtualBox, FreeBSD should consider trusting their TSC, or perhaps more likely, convince them to fix their TSC. For DigitalOcean, FreeBSD should look at how DigitalOcean reports CPU vendor so they can detect it as Intel and use TSC if appropriate. The one thing we may want to do is drop HPET entirely if system calls are faster, as your benchmark implies. Of course, your benchmarks are on completely different machines, so we'd want benchmarks of syscall vs HPET on the same machine to see if that is actually true. In theory it shouldn't be, as the system call probably results in HPET use in the kernel. |
|
Got benchmarks and profiles for different HPET$ sysctl kern.timecounter.hardware=HPET kern.timecounter.hardware: HPET -> HPET 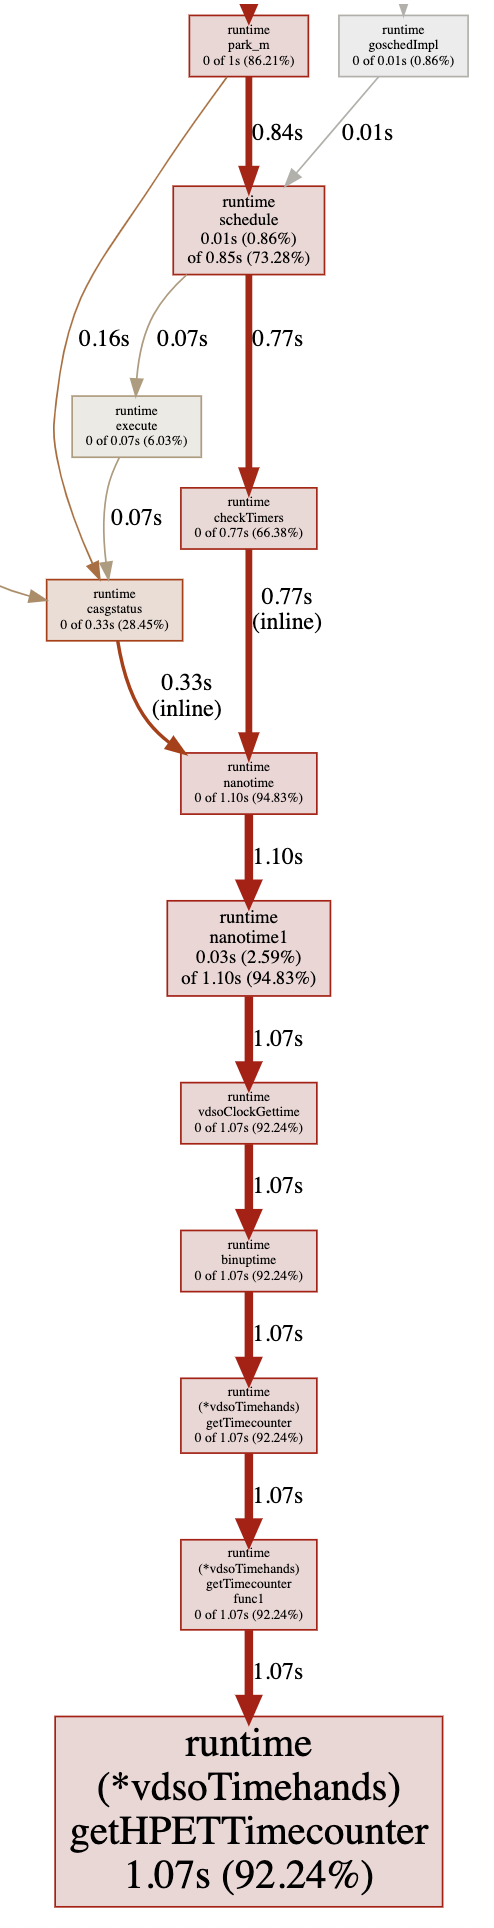
ACPI-fast$ sysctl kern.timecounter.hardware=ACPI-fast kern.timecounter.hardware: HPET -> ACPI-fast 
TSC-low$ sysctl kern.timecounter.hardware=TSC-low kern.timecounter.hardware: ACPI-fast -> TSC-low 
As an interesting fact, a profiling with TSC-low seems not consuming additional resources. |
|
I have also benchmarked Notice huge advantage of TSC-low. |
|
Edit: The reverse is true, see: #50947 (comment) Original Comment: FWIW, and hopefully it's helpful... with the following simple benchmark, I found HPET significantly faster than TSC-Low, which was being selected for my FreeBSD Guests (12.x and CURRENT, 2 core, 8gb each) on VirtualBox (Win64, Intel 2600K) prompting setting a HPET value in /etc/sysctl.conf. I had been testing to try to identify performance differences between VirtualBox's Paravirtualization provider settings. If I also recall correctly, there were some timecounter changes around that time (benchmark result files are dated Apr 18 2021), and/or discussion about TSC/ACPI-Fast performance particularly in FreeBSD's hypervisor detection code (so its worth going over those logs, if one hasn't already). I seem to recall that detection was 'incorrect' (or not optimal) for a time, and then updated as the HV strings had changed or something. sysctl.conf and benchmark resultsBench |
|
Enabling HPET for my VirtualBox and using @koobs benchmark along with 1CPU VBox 2CPU VBox 1CPU DO 2CPU DO |
|
@koobs looking at your output of |
@koobs Looking into VirtualBox a little more, it seems that they have a variety of conditions to select between hardware TSC (no VM exit) and emulated TSC (VM exit on every RDTSC), most notable of which is that it sounds like (not 100% sure) they require VMX TSC offsetting support to use hardware TSC. Intel 2600K is a older Sandy Bridge core and consumer SKU, so perhaps it doesn't support TSC offsetting, hence a fallback to emulated TSC with poor performance. I think you'd need to read various VMX capability MSRs to verify. @TriAnMan Very interesting that you consistently find ACPI-fast via a syscall faster than userspace HPET. Though it is still not clear if the syscall would still be faster if the system was still in I still don't think that there is anything for Go itself to do here. It is clear that FreeBSD's kernel clock selection is not always optimal. Go could second guess the kernel's choice in some cases (HPET vs syscall), but even if that helps, it would only help Go programs. If the kernel itself improves its clock selection then all programs on the system will benefit. |
|
Perhaps some documentation could be considered if Go is particularly affected? Eg, platform caveats/notes. This seems like something people might assume id Go's fault (and is unlikely to be widely understood). |
Ugh, thanks to you, I just realised the bench reports syscall counts and not latencies. I must have been drowning in yaks that day. My apologies :| So contrary to my original: #50947 (comment) TSC-Low is the fastest, and HPET the slowest. The numbers for acpi-fast, hpet and tsc-low are (with a 1 million rounds per run, on 2-core vbox guest) ACPI-fast237301 243384 242953 244564 243750 242997 240318 239218 239812 237116HPET140750 142011 142703 142432 139595 140107 143041 142407 142729 141270TSC-Low366357 365972 369583 364411 369548 371410 367791 364049 365786 355667 |
|
This was the relevent commit I referred to earlier re TSC & VirtualBox: Note: Things may have changed since, I have not reviewed TSC or other timecounter changes since then. I've not observed issues with TSC myself, but this is what FreeBSD is seeing and doing currently (CURRENT) On 12.3 (the above commit was not merged to stable/12) Additional References: |
|
I've made some benchmarks with the commit switching off TSC and HPET paths in Go: TriAnMan@6160d56 1CPU VBox 2CPU VBox So it looks like syscall uses a timecounter configured with |
|
Change https://go.dev/cl/391856 mentions this issue: |
|
I've sent a small improvement above, for the HPET timecounter path to switch to the system stack only once on first call. My system (AMD FX-8300 hardware) shows a small improvement in For example forcing HPET, then disabling go/src/runtime/vdso_freebsd.go Lines 52 to 54 in 7b1ba97 go/src/runtime/vdso_freebsd.go Lines 99 to 114 in 7b1ba97 There's a noticeable difference: Specifically ACPI-safe is much slower: FreeBSD 12.3 added support for kvmclock, I believe it should be much faster than using HPET (which is essentially a non-paravirtualized emulated hardware device). I'll try to prepare a PR for it when I have the time. |
|
What is the current status here? This issue is currently in the 1.19 milestone. Should it move to 1.20? To Backlog? Thanks. |
|
I did a small improvement on the HPET code path, it has a +2 review and wait-release in the PR. I'll do the kvmclock after I've finished with removal of the COMPAT_FREEBSD11. Moving to 1.20. |
|
Change https://go.dev/cl/422977 mentions this issue: |
|
Change https://go.dev/cl/422978 mentions this issue: |
Call only initHPETTimecounter on the system stack. Use O_CLOEXEC flag when opening the HPET device. FreeBSD 12.3-RELEASE-p2, AMD FX-8300 paulzhol@relic:~/go/src/time % ~/gocode/bin/benchcmp old_hpet.txt new_hpet.txt benchcmp is deprecated in favor of benchstat: https://pkg.go.dev/golang.org/x/perf/cmd/benchstat benchmark old ns/op new ns/op delta BenchmarkNow-8 1420 1397 -1.62% BenchmarkNowUnixNano-8 1421 1404 -1.20% BenchmarkNowUnixMilli-8 1423 1405 -1.26% BenchmarkNowUnixMicro-8 1423 1404 -1.34% Update #50947 Change-Id: I553b5427fb0b86d7e070af4516b36326bc0aaf00 Reviewed-on: https://go-review.googlesource.com/c/go/+/391856 Reviewed-by: Michael Knyszek <mknyszek@google.com> Reviewed-by: Michael Pratt <mpratt@google.com>
as setup by the kernel on GOARCH=arm64. Update #50947 Change-Id: I2f44be9b36e9ce8d264eccc0aa3df10825c5f4f9 Reviewed-on: https://go-review.googlesource.com/c/go/+/422977 Reviewed-by: Heschi Kreinick <heschi@google.com> Reviewed-by: Ian Lance Taylor <iant@google.com> TryBot-Result: Gopher Robot <gobot@golang.org> Reviewed-by: Meng Zhuo <mzh@golangcn.org> Reviewed-by: Dmitri Goutnik <dgoutnik@gmail.com> Run-TryBot: Yuval Pavel Zholkover <paulzhol@gmail.com>
|
What else is left to do here? There appears to be one outstanding CL. Since this was already moved forward a few times, I'm moving it to the backlog for now. Thanks. |
The setup
1.17.6 is currently the latest release.
go envOutputThe case
I've found that the performance of the scheduler on FreeBSD highly depends on the CPU setup I have. While it is OK for a one-CPU VirtualBox instance running on my Mac, it decreases a lot either for more-than-one-CPU VirtualBox or for any-number-of-CPUs DigitalOcean instances (as far as I know DigitalOcean uses KVM as a hypervisor for their instances).
This benchmark can be used as a minimal reproducer
package whatever import ( "testing" ) func BenchmarkScheduler(b *testing.B) { ch := make(chan struct{}) go func() { for range ch {} }() for i := 0; i < b.N; i++ { ch <- struct{}{} } }While this benchmark runs on a single-CPU VirtualBox instance it performs quite convenient.
However if the benchmark was run on more-than-one-CPU VirtualBox or on a DigitalOcean instance with any number of CPUs the significant decrease in performance emerges.
Profiling shows that the scheduler code for FreeBSD relies highly on time machinery. And
runtime.nanotime()performance highly affects the scheduler.Execution flow for 1CPU VirtualBox
Execution flow for 2CPUs VirtualBox
Execution flow for 1CPU DigitalOcean
I've also made benchmarks for the
time.Now()function in the same setups. The results of them correlates with scheduler ones.The text was updated successfully, but these errors were encountered: