runtime: Simple HTTP server causes high thread count on macOS Monterey #49679
Comments
|
cc @neild |
|
@chrisprobst thank you for the report and happy new year to you and to you @heschi :-) @chrisprobst, I am on MacOS Monterrey as well and I've failed to reproduce this problem with various values of -c and -t in ranges too
go1.17.5go-49679-1.17.5.mp4go1.18go-49679-1.18.mp4@chrisprobst can you reproduce this even right now? |

|
@odeke-em Hi, thanks for checking. I am running on M1 Max CPU and 12.0.1 (so still not updated to 12.1, will do shortly). The problem exists both for 1.17.5 and 1.18Beta1. Will notify you when updated to 12.1. |
|
@odeke-em I've updated to 12.1, same results. Can you reproduce with an M1 Max? I have the feeling it is linked to the M1 architecture. But the problem is still present. With Rust, etc. this problem is not present so it is related to thread management of Go probably. |
|
Interesting, thank you @chrisprobst! Let me kindly ask a colleague @kirbyquerby who has an M1 to try to reproduce it, and then I shall go purchase an M1 Pro or M1 Max computer tomorrow morning too and try to reproduce it then debug it. |
|
Here's my results with Go 1.17 on Big Sur and then after updating to Monterey. The number of threads seemed to increase (peak 22 on Big Sur -> 32 on Monterey) but didn't balloon to large values like in the OP. Big Sur results: Monterey results: `go env` outputLet me know if I can help test anything else :D |
|
I will record a video as soon as I can. In my example, the Threads go up to the hundreds. |
1.17.5.mp4 |
|
@odeke-em @kirbyquerby As you can see, the threads go extremely high. It's now macOS 12.1 and Go 1.17.5 (1.18beta1 is the same). |
|
@kirbyquerby I noticed that you are using an M1, maybe it's related to M1 Max? The Low-Power cores are different, maybe it is somehow affected by this? |
|
Is this possibly related to some security software on that laptop; previously users have reported that “anti virus” software from semantic and McAfee tend to have detrimental impact on macOS computers. |
|
I diff'd our |
|
@davecheney It's a stock device used in our lab. Based on the feedback it really sounds like an M1 Max issue. |
|
I tested this app on a few other M1 Pro and also Max devices (same CPU), same result. |
|
CC @cherrymui |
|
Unfortunately there isn't much we can do for Go1.18 but we are keeping this open for investigation for Go1.19 and if/when we encounter a need for a fix, we can backport. Moving this to the Go1.19 milestone. Thank you @chrisprobst and everyone. |
|
After the release 1.18 I did some more tests and found some interesting observations that I would like to share, maybe it helps. The M1 Max (Pro) has 8 performance cores and 2 efficiency cores. When I limit the processor count using GOMAXPROCS, the behaviour changes completely. If I set a value between 1-4 (GOMAXPROCS=1 ... GOMAXPROCS=4), the problem disappears. The problem suddenly starts with GOMAXPROCS=5+. Also, with a value between 1-4 the performance is superb, as usual and expected. The numbers mean nothing, but the delta is interesting: With 1-4 I get 175K req/s with wrk and the thread count stays under 10. I am not too much into how Go's scheduler works exactly but I do know that slow syscalls might cause other threads to spawn to take over. Now, maybe the efficiency cores are too slow to take over and Go thinks the syscall takes too long and therefore simply spawns another thread? If this is true, even modern Alder Lake CPUs with Big.Little might have similar issues. Let me know your thoughts. |
|
CC @golang/runtime I guess this did't get investigated for 1.19. Rolling forward to 1.20. |
|
Just tested lately with latest 1.19 and up-to-date M1 Pro device, same result. The simple HTTP server listed above still generates hundreds of threads on macOS. I've already mentioned that only a value of GOMAXPROCS=5+ causes issues. An M1 Pro/Max has 8 performance cores and 2 efficiency cores. A value of 4 works perfectly, so half of the performance cores. Not sure, maybe it's linked. I really believe that the efficiency cores are the problem, maybe they take so much longer compared to high performance cores for certain operations that Go thinks it has to spawn a new thread to keep up with the load. Could this be related? |
|
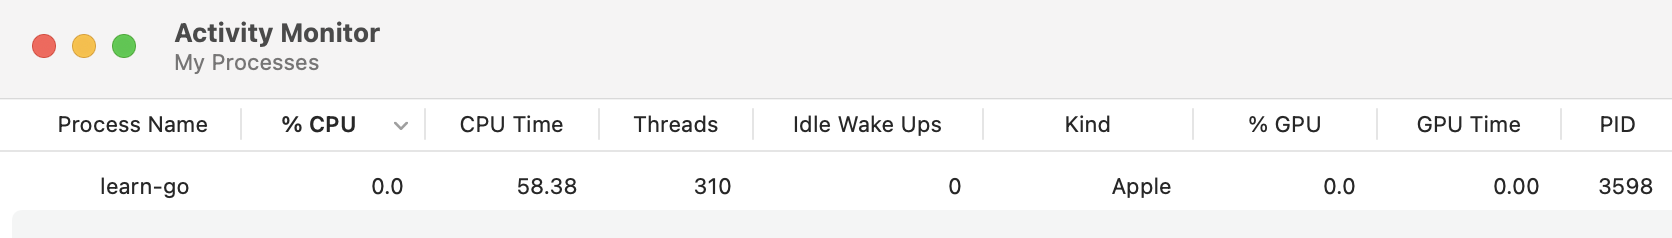
A lot of time has passed by now and I still have an eye on this topic. Meanwhile, I have access to an M4 Max chip (but tested over the years all generations). What is interesting to see is that Go's performance of simple HTTP benchmarks degraded over the years on macOS. Sure, it's not a server environment. But newer chips get faster while Go's performance with growing version numbers get slower. This is by no means scientific and I don't want to open pandoras benchmark box. Really, I don't. But, it is still interesting because this simple http benchmark (the one from the top of this issue) is enough to trigger entirely different behavior on macOS over the years. Previously, and a main driver of this issue was the high thread count. This is solved, I cannot reproduce it anymore. Thread count never grows crazy like in the beginning of this issue. But now, something entirely else is strange. The "Idle Wake Ups" as shown in macOS' System Monitor grow like crazy. And I mean crazy. So for a simple web server and wrk hammering it I get up to 50K wake ups, which is totally insane. This test is on all cores maxed out and a req/s rate of roughly 80-90k which is really low. A Rust server (stupid simple Tokio echo) peaks out at 210K req/s with barely above 100 Idle Wake Ups (yes, 100! not 50K!). But, don't get me wrong here. This is no Rust vs. Go and I know that Rust in theory is faster due to memory allocs in Go. But please, bear with me. Because it gets even more interesting for us Gophers. When I limit the number of threads to 1 (GOMAXPROCS=1), I get 130K/s in Go with ... still high Idle Wake Ups, but less (about 10k-15k). These numbers mean nothing, they simply show the delta here. I would like to revive this thread and ask for insights about the Go scheduler and maybe related to that the interrupt-based preemption. I think, the Go scheduler has issues on macOS in high performance scenarios which shouldn't exist. If there is any interest from the Go team to investigate this, let me know. Then I can provide more test data like screen recordings etc. |
|
Can you collect a CPU profile of this server while it is under the load test? My initial guess would be that something about the load makes it such that runtime threads are constantly going to sleep and waking back up rather than just staying awake like they should under high load. |
|
Sure, so let's go. Just be clarify, we are still talking about the most basic HTTP hello world server, it can't get simpler than that. I'll copy the code from above for reference: package main
import "net/http"
func main() {
http.HandleFunc("/", func(rw http.ResponseWriter, r *http.Request) {
rw.WriteHeader(200)
})
if err := http.ListenAndServe(":8080", nil); err != nil {
panic(err)
}
}$ go run .$ wrk -d10 -c250 -t4 http://localhost:8080 [23:07:34]
Running 10s test @ http://localhost:8080
4 threads and 250 connections
Thread Stats Avg Stdev Max +/- Stdev
Latency 3.09ms 352.57us 8.68ms 75.67%
Req/Sec 20.01k 575.48 21.29k 74.25%
796637 requests in 10.00s, 56.98MB read
Requests/sec: 79644.38
Transfer/sec: 5.70MB(For reference, a Spring Boot gets 120K/s and Rust Axum gets 250K/s - Numbers mean nothing, just the delta. Both Rust and Java do NOT cause any major Idle Wake ups, a few hundred. Go goes crazy with about 40-50K). Here is the result from profiling: Showing nodes accounting for 56.32s, 99.00% of 56.89s total
Dropped 155 nodes (cum <= 0.28s)
Showing top 10 nodes out of 48
flat flat% sum% cum cum%
35.87s 63.05% 63.05% 35.87s 63.05% runtime.kevent
14.98s 26.33% 89.38% 14.99s 26.35% syscall.syscall
2.90s 5.10% 94.48% 2.90s 5.10% runtime.pthread_cond_wait
1.49s 2.62% 97.10% 1.49s 2.62% runtime.usleep
1.03s 1.81% 98.91% 1.03s 1.81% runtime.pthread_cond_signal
0.01s 0.018% 98.93% 7.30s 12.83% bufio.(*Reader).fill
0.01s 0.018% 98.95% 0.31s 0.54% net/http.(*connReader).backgroundRead
0.01s 0.018% 98.96% 0.34s 0.6% runtime.runqgrab
0.01s 0.018% 98.98% 2.94s 5.17% runtime.semasleep
0.01s 0.018% 99.00% 0.37s 0.65% runtime.stealWorkAnd web vis:
Sorry, I use German interface, "Reaktivierung" means Idle wake ups.
I hope this helps in any way. This should also be super trivial to test and/or replicate. I tested this on M3 Pro/Max & M4 Pro/Max (latest macOS) and get the same identical result every time. |


|
To provide the whole picture: When I run: GOMAXPROCS=1 go run . $ wrk -d10 -c1000 -t4 http://localhost:8080 [23:33:26]
Running 10s test @ http://localhost:8080
4 threads and 1000 connections
Thread Stats Avg Stdev Max +/- Stdev
Latency 7.21ms 1.16ms 17.92ms 79.21%
Req/Sec 34.53k 4.02k 38.21k 86.25%
1374247 requests in 10.01s, 98.29MB read
Socket errors: connect 0, read 3342, write 0, timeout 0
Requests/sec: 137302.50
Transfer/sec: 9.82MBI get very low Idle wake ups (around 50-80). If I had to guess, I am sure it's somewhere in the go scheduler, work-stealing, maybe interrupt-based preemption or how kevent is implemented in Go. To me, this is clearly a misbehavior on macOS. I have too little knowledge about the internals of Go but this is so easy to replicate I wonder this never caught someones attention.
|

|
Thanks, this is helpful. I can reproduce this on one of our remote testing gomotes ( I see high wakeups: The command also shows the distribution of different interrupt types: These are all less than 100/s when the load test is not running. Seems close to 50/50 between IPI (cross-CPU wakeup) and timers. [1] For those reading along, the |
|
The immediate cause appears to be as I theorized, that I found the The general flow that I believe is happening:
With 4 worker threads, I see ~40k wakeups. If I give I can also see in CPU profiles that time in the Go scheduler drops from 16% -> 5% -> 2%. The final 3k number is still pretty high. I'm not sure why, it needs more investigation. It might just be that Go still ends up with no work due to OS scheduling effects sometimes not running enough I'm also not sure why tokio is doing better by default. It may be running fewer worker threads, or it may be spinning longer waiting for work before going to sleep. We have been thinking for a long time about ways to eliminate GOMAXPROCS entirely and dynamically determine the amount of parallelism currently available in order to dynamically adjust. This problem sort of fits in that domain, but it is backwards: the machine has plenty of available parallelism to run one thread per request, but the request handler is so fast that it would be more efficient to just run one thread and queue the requests behind one another (this is what happens with GOMAXPROCS=1). However, the Go scheduler today is work conserving (#54622), meaning if there are idle CPUs and runnable work, we always use the idle CPUs. Determining in the scheduler that it is better to break this property because the cost of wake+sleep is higher than the latency of waiting to run sequential is difficult to determine a priori. |
|
To be clear, this is a well-known (to me at least :)) issue with the Go scheduler. If there is lots to do, the Go scheduler does well keeping busy. If there are long periods of nothing to do, things go to sleep and it works well. However, if the application switches between active and idle very rapidly it behaves poorly due to the relatively high cost of going to sleep and waking back up. This is one of the cases that #54622 aims to improve. |
|
One more thought: in my worst case, I see 16% of CPU time in the Go scheduler, but your profile shows 72% of time in the Go scheduler, so you somehow have hit a much more extreme case than me. I'm not sure why. Perhaps you have more cores, resulting in a bigger mismatch between GOMAXPROCS and Though I take these profiles with a grain a salt, as macOS has suspicious profiling (#57722). |
|
Its worth noting that the M1 ARM CPU has 4 performance and 4 efficiency cores. |
|
Thank you for this holistic overview, really helpful. What you said makes total sense to me. Go is definitely implemented differently compared to Rust's tokio runtime or Java's, it might be more sophisticated and I totally agree that this is the mother of synthetic benchmarks. I can live with that fact if it's something that is truly caused by not enough load, which shouldn't be an issue in production where you normally have load. However, if it is for some reason caused/amplified by Apple's BIG.Little architecture (My machine has 12 performance and 4 efficiency cores M4 Max) maybe it helps to document this somewhere. I am tempted to suggest to close this issue finally after years as the original cause (huge number of opened threads) is gone. BUT, before doing so, let's think if these issues are maybe remotely related. Meaning, what manifests TODAY as high Idle Wake ups was maybe leading previously to high thread counts. The only difference is performance per core which got massively better (M1 Max vs M4 Max) and of course newer OS version in general. I think, I would like to be sure that there is not a bug in the scheduler or preemption mechanism on macOS. I haven't tested it on Windows/Linux machines with BIG.Little arch, if someone has hardware to test this, maybe it's worth a shot. I'll hand it over to you whether or not closing this issue is now the right thing, I am just a curious user. |
|
I've created #73055 to track the idle wake up count issue separately because it happens even without network. Check out the new issue for more information. |
|
I'll close this issue now because the original high thread count issue seems to be resolved and the high idle wake up count issue seems unrelated to network so it might be better to track it separately. |
What version of Go are you using (
go version)?Does this issue reproduce with the latest release?
Cannot test 1.17.3 currently.
What operating system and processor architecture are you using (
go env)?Apple M1 Max MacBook Pro 16.
go envOutputWhat did you do?
wrk -c500 -d10 -t1 http://localhost:8080What did you expect to see?
With the previous macOS versions (as with every other OS I've tested lately) the app uses a couple of threads (usually around 8-12 all the time).
What did you see instead?
Thread count goes very high and never drops:
The text was updated successfully, but these errors were encountered: