runtime/pprof: block profiler: fix sampling bias #44192
Comments
|
@seankhliao would it make sense to add the label "proposal" for this? I'm afraid it might not be reviewed otherwise. |
|
cc @hyangah |
|
Thank you for the detailed explanation and writeup. cc @dvyukov (blockprofile author), @pjweinb (mutexprofile author), @rsc (heap profile author) - all three profiles share similar sampling logic. Improving sampling bias sounds great. I have very limited experience with blockprofile so I want to learn more about the goal here. In your motivating example scenario, why is it important to present the two kinds of events equally? If one type of events usually block 10x longer on average, isn't it more interesting and worth more attention? |
|
@hyangah thx.
It's similar, but I think all three of them use slightly different approaches:
Great point. I think it depends : ). I could imagine a scenario where you have two producers sending work into two separate channels, sometimes getting blocked while doing so. I'd expect the block profiler to be able to tell me which of those two producers is spending more time blocked than the other. Given the current bias, it could give me the wrong answer to that question. Or from another point of view, imagine if the heap profiler was biased towards big allocations (i hope it isn't, still need to analyze it some more). It could make you chase a few big allocation sources even so they may contribute less overall garbage than thousands of small allocations that the profiler is telling you to ignore by under-representing them. Anyway, I'd be okay if the bias is here to stay. But if it is, I think it's worth documenting, which I'd be happy to send patches for. |
|
Interesting. I can see how this change makes sense: Have you looked at what's done in tcmalloc? |
Cool : ). Do you think the fact that it obscures the mean of the samples (total_delay / count) is a problem? It's kind of a nice thing to be able to compute, but OTOH I'm not sure if anybody ever looks at it.
Not yet, thanks for the link!
If the current heap sampling could be improved, that'd be awesome. But I'll need some time to fully wrap my head around the current Go implementation as well as tcmalloc's sampler before I could contribute anything useful to that discussion. If you're aware of any good design documents or literature discussing heap sampling techniques, please let me know. |
Lie in profiles is definitely bad. If I see any numbers that definitely look like a lie I may throw away whole profile b/c I don't know what I can trust there.
I am not aware of anything besides comments in sampler.h: |
👍 I love this perspective / mindset.
This sounds interesting, but I don't think I understand it. Can you explain it differently? |
In saveblockevent we do: You change increases cycles, but count is still incremented by 1. This makes average incorrect. This increases cycles, but also proportionally increases count. |
|
Edit: I updated this comment, you can still see the original below, but I've hidden it because it was confusing. Old Comment (Please ignore)
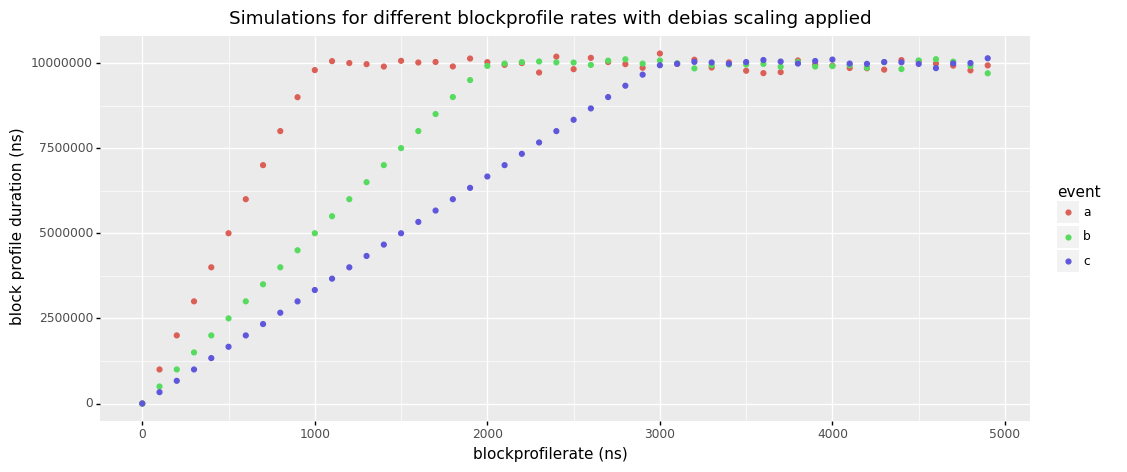
I spend some time thinking and playing around with this. I'm assuming your snippet above would be used instead of the patch I proposed? If that's the case, I think it will fix the sample mean issue, but flip the total duration bias towards short frequent events favored over long infrequent events. Example 1: Example 2: As you can see, the total cycles in example 1 end up being twice as high as in example 2, even so both events contribute the same amount of blocking. Unless I'm missing something, I think the only way to fix the bias without screwing the sample mean is to either change the logic used for deciding which events get sampled, or to add the mean as its own value type into the profile. But maybe there is an elegant solution I'm overlooking. FWIW, I also played with a little simulation for your suggestion. Below you can see the impact of the rate on an application that produces three distinct block events a, b, c with a population mean of 1000ns, 2000ns and 3000ns respectively.
And this is how things look right now before applying any patches:
@dvyukov it took me a bit to figure out if you were suggesting this change in addition to my patch or instead of it. Neither combination seemed to work. However, I think I finally figured out that your idea could be applied by a new patch that simply does this inside of if cycles < rate {
	b.bp().count += rate/cycles
	b.bp().cycles += rate
} else {
b.bp().count += 1
b.bp().cycles += cycles
}I'll think this over again tomorrow when it's not late, but I'd be happy to send a patch + tests for this if you agree. Let me know. |

|
Yes, I meant in combination with your patch. Something similar to the snippet you posted. I just did not elaborate enough, sorry. |
No worries, in retrospect I think it was clear enough, but my brain didn't want to collaborate 🙈. I'll try to prepare a patch for this now to continue the discussion. |
Block profiles were biased towards infrequent long events over frequent
short events. This fix corrects the bias by aggregating shorter events
as longer but less frequent in the profiles. As a result their
cumulative duration will be accurately represented in the profile
without skewing their sample mean (duration/count).

Credit to @dvyukov for suggesting to adjust the count in the
saveblockevent function.

Fixes golang#44192.
|
I see Heap profiler's sampling is more similar to what tcmalloc sampler is doing - having an internal counter to keep track of the next sampling point instead of tossing a coin every time. Is it an option to change the block profile sampler to be more similar to what the current heap profiler or tcmalloc sampler are doing? |
|
@hyangah I think the main concern there would be doing this in a way that doesn't fundamentally impact the overhead of block profiling or change the semantics of the Meanwhile I got a patch ready based on @dvyukov's suggestions here: felixge@a3dc518 But I'll hold off on submitting it for now. I also still have to sort out some CLA stuff on my end. |
Block profiles were biased towards infrequent long events over frequent
short events. This fix corrects the bias by aggregating shorter events
as longer but less frequent in the profiles. As a result their
cumulative duration will be accurately represented in the profile
without skewing their sample mean (duration/count).

Credit to @dvyukov for suggesting to adjust the count in the
saveblockevent function.

Fixes golang#44192.

Change-Id: I71a99d7f6ebdb2d484d44890a2517863cceb4004
|
Change https://golang.org/cl/299991 mentions this issue: |
Block profiles were biased towards infrequent long events over frequent
short events. This fix corrects the bias by aggregating shorter events
as longer but less frequent in the profiles. As a result their
cumulative duration will be accurately represented in the profile
without skewing their sample mean (duration/count).

Credit to @dvyukov for suggesting to adjust the count in the
saveblockevent function.

Fixes golang#44192.

Change-Id: I71a99d7f6ebdb2d484d44890a2517863cceb4004
What version of Go are you using (
go version)?Does this issue reproduce with the latest release?
Yes.
What operating system and processor architecture are you using (
go env)?go envOutputWhat did you do?
I created a program with 2 goroutines. One is blocked on a slow
time.NewTicker()loop, the other on one that is 10x faster. Then I observed the program using the block profiler with the duration of the slow ticker as the rate.Code: https://gist.github.com/felixge/6f9701dd26707dbe7d351805860a4608
What did you expect to see?
Both goroutines are blocked 100% of their time, so I'd expect both of them to show up equally in the block profile like shown below:
What did you see instead?
The block profiler sampling seems to be biased, preferring infrequent long block events over frequent short events, even when they contribute to the same amount of overall blocking. This can be seen in the block profile result I actually got:
I've done a lot of additional research on this which can be found here: https://github.com/felixge/go-profiler-notes/blob/main/block.md#sampling-bias
Proposal
I propose to fix the profiler in a way that removes the sampling bias without changing the API or increasing overhead. Concretely this might be done with a patch like this:
felixge/go@master...debias-blockprofile-rate
I've described this in more detail along with a simulation here: https://github.com/felixge/go-profiler-notes/blob/main/block.md#simulation--proposal-for-improvement
The downside to this approach is that it will obscure the "average event duration" which could currently be determined by dividing the
delay/nanosecondsby thecontentions/countvalues in the profile. I have a few ideas around this that I'd be happy to discuss.Additionally I propose to improve the documentation for the block profiler to give people a better idea what the
ratevalue means and perhaps also make some recommendations about overhead.I'm happy to work on all of the above and submit the patches for it.
The text was updated successfully, but these errors were encountered: