runtime: difficult to find memory leak that is a result lots of defers in a hot loop #42357
Comments
|
Defers are function scoped not block scoped. It appears that you have solved your problem, what is left to address in this issue? |
|
@josharian encouraged me to file an issue after helping me debug this over on gophers #performance slack. I have solved my memory leak bug but pprof didn't really help in this case - I thought it might be useful to share my experience and start a discussion on whether pprof could be improved to catch issues like this in the future. |
|
Could you post a cpu svg for the same trace, I’m hoping it might point to newdefer in some way. |
|
/cc @hyangah |
|
|
What version of Go are you using (
go version)?Cross compiled for GOOS=linux GOARCH=arm GOARM=7.
Does this issue reproduce with the latest release?
yes
What operating system and processor architecture are you using (
go env)?go envOutputWhat did you do?
I tried to use pprof to debug a memory leak in a long running program that was showing growth in live objects (
MemStats.Mallocs - MemStats.Frees) over time.What did you expect to see?
pprof to reveal the problematic code that was causing the leak.
What did you see instead?
Setting
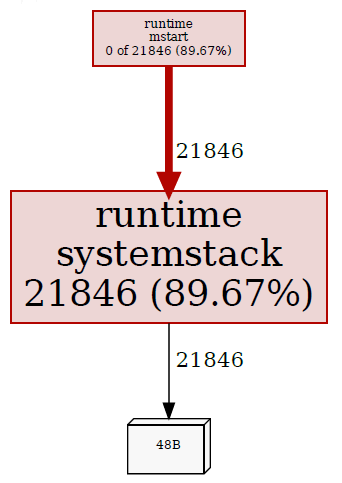
sample_index=inuse_objectsand running top showed lots of objects coming fromruntime.systemstack. pprof was not giving useful info regarding what is actually running on the stack and causing the leak of live objects.webandpeekshowed thatruntime.mstartwas callingruntime.systemstacksuggesting a possible leak of threads.However this was not actually relevant, I think due to this line in asm_arm.s that states "make it look like mstart called systemstack on g0, to stop traceback".
After lots of manual debugging, the culprit was found to be a bug in my code where a
deferwas being called in a hot and long running loop, rather than being called once before the loop.e.g.
With bug - http://play.golang.org/p/0AzEwnbplyq
Bug fixed - http://play.golang.org/p/VbTEFgYXmMI
This was causing lots of calls to
runtime.newdeferwhich was appending to the defer pool in a systemstack block:I'm not sure what could be done to fix this, but it would have been nice if pprof was able to point me to the offending code more directly.
The text was updated successfully, but these errors were encountered: