Skip to content
New issue

Have a question about this project? Sign up for a free GitHub account to open an issue and contact its maintainers and the community.

By clicking “Sign up for GitHub”, you agree to our terms of service and privacy statement. We’ll occasionally send you account related emails.

Already on GitHub? Sign in to your account

runtime: RSS keeps on increasing, suspected scavenger issue #36398

Closed
dbakti7 opened this issue Jan 6, 2020 · 27 comments
Closed

runtime: RSS keeps on increasing, suspected scavenger issue #36398

dbakti7 opened this issue Jan 6, 2020 · 27 comments
Labels
FrozenDueToAge WaitingForInfo Issue is not actionable because of missing required information, which needs to be provided.

Comments

@dbakti7
Copy link

dbakti7 commented Jan 6, 2020

What version of Go are you using (go version)?

$ go version
go.13.4 linux/amd64

Does this issue reproduce with the latest release?

Yes, similar symptoms shown with go 1.13.5.

What operating system and processor architecture are you using (go env)?

go env Output
$ go env
GO111MODULE=""
GOARCH="amd64"
GOBIN=""
GOCACHE="/home/dbakti/.cache/go-build"
GOENV="/home/dbakti/.config/go/env"
GOEXE=""
GOFLAGS=""
GOHOSTARCH="amd64"
GOHOSTOS="linux"
GONOPROXY=""
GONOSUMDB=""
GOOS="linux"
GOPATH="/home/dbakti/go"
GOPRIVATE=""
GOPROXY="https://proxy.golang.org,direct"
GOROOT="/usr/local/go"
GOSUMDB="sum.golang.org"
GOTMPDIR=""
GOTOOLDIR="/usr/local/go/pkg/tool/linux_amd64"
GCCGO="gccgo"
AR="ar"
CC="gcc"
CXX="g++"
CGO_ENABLED="1"
GOMOD=""
CGO_CFLAGS="-g -O2"
CGO_CPPFLAGS=""
CGO_CXXFLAGS="-g -O2"
CGO_FFLAGS="-g -O2"
CGO_LDFLAGS="-g -O2"
PKG_CONFIG="pkg-config"
GOGCCFLAGS="-fPIC -m64 -pthread -fno-caret-diagnostics -Qunused-arguments -fmessage-length=0 -fdebug-prefix-map=/tmp/go-build065316270=/tmp/go-build -gno-record-gcc-switches"

What did you do?

We are experiencing RSS that keeps on increasing in one of our Go service. We are suspecting it's due to scavenger not returning memory to OS properly (or OS not taking back the memory due to use of MADV_FREE). Checked via pprof, no memory leak detected.

We tried some experiment with the following simple Go program:

package main
import (
  "fmt"
  "time"
)

func allocate(s int) {
  a := make([]byte, s * 1024 * 1024)
  for i := 0;i < len(a); i += 4096 {
    a[i] = 'x'
  }
  fmt.Printf("%c %d\n", a[0], s)
}

func main() {
  allocate(100)
  allocate(200)
  allocate(500)
  time.Sleep(300 * time.Second)
}

running with strace -q -e trace=memory go run main.go
results are not consistent:

running with gctrace, we got: https://pastebin.com/6JaC2r85
we confirmed that RSS remains high via top and pmap:

$ pmap -x 22712
22712:   /tmp/go-build073210395/b001/exe/main
Address           Kbytes     RSS   Dirty Mode  Mapping
0000000000400000     576     428       0 r-x-- main
0000000000490000     756     320       0 r---- main
000000000054d000      84      56      32 rw--- main
0000000000562000     120      36      36 rw---   [ anon ]
000000c000000000  983040  819440  397680 rw---   [ anon ]
00007fcdfb2e1000   66684   26780   26780 rw---   [ anon ]
00007fffa3ba2000     132      20      20 rw---   [ stack ]
00007fffa3bdf000       8       4       0 r-x--   [ anon ]
ffffffffff600000       4       0       0 r-x--   [ anon ]
---------------- ------- ------- -------
total kB         1051404  847084  424548

According to #30333, in go 1.13 scavenging should be performed periodically instead of waiting for the 5 minutes interval, but there is no MADV_FREE logged by strace sometimes. gctrace does print logs about scavenging, but seems like it's not really calling MADV_FREE? Am I missing something regarding this scavenging logic in go 1.13?

Tried with GODEBUG=madvdontneed=1, result is better, but RSS still hovering at around 500MB, only when we combine madvdontneed with debug.FreeOSMemory() then we got RSS < 30MB. Is this the only way to ensure Go is returning memory back to OS in Linux?

What did you expect to see?

RSS is gradually going down, or at least MADV_FREE captured by strace.

What did you see instead?

RSS remains high, no MADV_FREE captured by strace.

Additional notes: running the same program on windows with go 1.13 seems to have the desired effect, i.e. memory is gradually released back to OS.

@agnivade agnivade changed the title Go 1.13 RSS keeps on increasing, suspected scavenger issue runtime: RSS keeps on increasing, suspected scavenger issue Jan 6, 2020
@agnivade agnivade added the NeedsInvestigation Someone must examine and confirm this is a valid issue and not a duplicate of an existing one. label Jan 6, 2020
@dbakti7
Copy link
Author

dbakti7 commented Jan 6, 2020

Update: I tried again with go 1.13.0, this time strace captures many madv_free as expected: https://pastebin.com/Hwy2DKt4
regress?

@ianlancetaylor
Copy link
Contributor

CC @aclements @mknyszek

@mknyszek
Copy link
Contributor

mknyszek commented Jan 7, 2020

@dbakti7 strace -q -e trace=memory go run main.go is giving you an strace for the go command, not the executable built for main.go. Build it first (go build) then run the executable under strace. The madvise syscalls should then line up with what gctrace reports.

The 0 MiB reported by gctrace is also misleading because it rounds down (sorry about that). Every time you see X MiB released that means there was at least one madvise syscall made. Furthermore, this number is only what the background scavenger does; we also have a heap-growth scavenger which, judging by the gctrace, is doing the heavy lifting.

Finally, Linux's MADV_FREE is known to not actually modify any RSS counters until pages are purged due to memory pressure. MADV_DONTNEED does update RSS counters but is more expensive and makes the next page fault on those pages more expensive. We fall back to that if MADV_FREE is not available, or if GODEBUG=madvdontneed=1 is set. I would suggest trying that out to see if the RSS counters look more reasonable. The runtime thinks that most of the memory is in fact returned to the OS (the "released" counter in gctrace shows this).

With all that said, I'm not sure how to help with the RSS growth in your application unless you provide more information about its behavior (I don't mean specifics about the application, just how it interacts with memory). For example, is the heap itself growing really big? That is, if you run your service under gctrace, do you see the goal rising? If so, that could mean a GC pacing bug, or just that the runtime deems that your application needs that much memory and you haven't reached a steady-state. If it really is just RSS that's going higher than you expect, then it could be that simply setting GODEBUG=madvdontneed=1 will give you the behavior you expect for a minor performance hit.

@mknyszek mknyszek added WaitingForInfo Issue is not actionable because of missing required information, which needs to be provided. and removed NeedsInvestigation Someone must examine and confirm this is a valid issue and not a duplicate of an existing one. labels Jan 7, 2020
@dbakti7
Copy link
Author

dbakti7 commented Jan 8, 2020

@mknyszek Thanks for the elaborate explanation!
I tried your suggested approach, i.e. to build the executable first
for go 1.13.5: https://pastebin.com/3jvnkBJC
for go 1.13.0: https://pastebin.com/44veNiJK
both have similar behavior now, which is calling MADV_FREE for big chunk with size 209715200 bytes.
Not sure why it's different with gctrace reports (that seems to release memory in small chunks frequently), or maybe they refer to two different things? (i.e. I'm referring to the statement "Every time you see X MiB released that means there was at least one madvise syscall made")

And agree with your point regarding MADV_FREE and MADV_DONTNEED, problem is we are still unable to replicate our production load to see whether MADV_DONTNEED will improve our memory usage. :(
One clarification, since MADV_DONTNEED is set with GODEBUG flag, I hope the word "Debug" here doesn't mean it's not safe to be used in production env?

Regarding our application behavior, I think the most notable characteristic is it's doing a lot of json and string manipulation, especially json marshal and unmarshal. Which I suspect is the cause of high velocity object creation. (Is memory fragmentation a possible culprit? I'm not sure how Go runtime handles memory reuse and fragmentation if service is creating many objects rapidly)

@mknyszek
Copy link
Contributor

mknyszek commented Jan 8, 2020

@mknyszek Thanks for the elaborate explanation!
I tried your suggested approach, i.e. to build the executable first
for go 1.13.5: https://pastebin.com/3jvnkBJC
for go 1.13.0: https://pastebin.com/44veNiJK
both have similar behavior now, which is calling MADV_FREE for big chunk with size 209715200 bytes.
Not sure why it's different with gctrace reports (that seems to release memory in small chunks frequently), or maybe they refer to two different things? (i.e. I'm referring to the statement "Every time you see X MiB released that means there was at least one madvise syscall made")

That's odd. gctrace should print "X MiB released" times <= the number of syscalls you see in strace. I'll try this out.

And agree with your point regarding MADV_FREE and MADV_DONTNEED, problem is we are still unable to replicate our production load to see whether MADV_DONTNEED will improve our memory usage. :(

To be clear, it'll just improve reported memory use. MADV_FREE works fine, and will do the right thing under memory pressure, you just won't see counters go down. It depends on whether you use those counters for anything. If you don't, then you can instead estimate how much memory is being used by go by subtracting Sys - HeapReleased in MemStats.

One clarification, since MADV_DONTNEED is set with GODEBUG flag, I hope the word "Debug" here doesn't mean it's not safe to be used in production env?

It's fine to use in production. It doesn't print anything extra or do anything other than set a global variable.

Regarding our application behavior, I think the most notable characteristic is it's doing a lot of json and string manipulation, especially json marshal and unmarshal. Which I suspect is the cause of high velocity object creation. (Is memory fragmentation a possible culprit? I'm not sure how Go runtime handles memory reuse and fragmentation if service is creating many objects rapidly)

It could be fragmentation, though I don't think we have fragmentation blow-up issues in the Go runtime's allocator like some other allocators have. One way to confirm this would be a high value of float64(Sys - HeapReleased) / float64(HeapInUse) from MemStats. That would suggest a high amount of page-level fragmentation (or that the scavenger isn't doing its job). I know you're having a tough time replicating this now, but a dump of MemStats every once in a while would help a lot in understanding where the RSS is coming from. I mentioned earlier that it could be due to GC pacing, for example.

@dbakti7
Copy link
Author

dbakti7 commented Jan 10, 2020

We just found out that our ever-increasing RSS in production is due to prometheus somehow consuming a lot of memory over time, so should not be due to our go application GC issue in this case.
Will investigate our prometheus separately, closing this ticket.
@mknyszek Sorry for the false alarm, and thanks for the explanation.
Nevertheless, please update if you figured out why strace doesn't capture MADV_FREE as expected for the go program that I used as experiment above. Thank you!

@dbakti7 dbakti7 closed this as completed Jan 10, 2020
@dbakti7
Copy link
Author

dbakti7 commented Jan 10, 2020

ouch, sorry, my bad.. I interpreted prometheus response wrongly. I thought go_mem_stats reported by prometheus endpoint refers to the memory usage of prometheus only. Seems like it's reporting the memory usage of the application itself. Metrics itself is small, so should not be prometheus memory issue. Sorry for the back-and-forth confusion, reopen ticket, will investigate further.
but now we have one extra information from our production: https://pastebin.com/qX8gRuG6
it doesn't really tell what is consuming memory (and unfortunately we didn't enable pprof in production), but who knows someone could interpret some insights from these stats :)

@dbakti7 dbakti7 reopened this Jan 10, 2020
@dbakti7
Copy link
Author

dbakti7 commented Jan 11, 2020

One way to confirm this would be a high value of float64(Sys - HeapReleased) / float64(HeapInUse) from MemStats. That would suggest a high amount of page-level fragmentation (or that the scavenger isn't doing its job)

From go MemStats reported by Prometheus ~ (4GB - 2GB) / 1.7GB ~ 1.13
Just for sanity, I pulled MemStats from other container too: (3.3G - 3.2G) / 87MB ~ 1.15
I suppose this is considered low value?

In first container, heap_inuse is pretty notable (>1GB), but in second container it's very low (<100MB)
both have very high RSS reported, i.e. >4GB
and will get kill by OOM after some time, this is why I'm confused:

  • heap_in_use is low, means most likely there is no memory leak. CMIIW
  • both have high heap_idle, but somehow still get killed by OOM

@mknyszek
Copy link
Contributor

@dbakti7 The MemStats numbers indicate that everything is pretty much WAI; the OOMs however are not great and can be caused by a number of things. The high HeapSys value you're reporting suggests to me that your application has a high peak memory use though, either that or you have a really bad case of fragmentation (which is harder to diagnose).

For now, can you provide the following details?

  • What is the peak memory use for your application? (Either VmHWM from /proc/<id>/status or whatever Prometheus tells you is the peak HeapAlloc recorded for your application.)
  • Linux kernel version.
  • Linux overcommit settings (cat /proc/sys/vm/overcommit_memory and cat /proc/sys/vm/overcommit_ratio).
  • Is swap enabled on your system? If so, how much swap space do you have?

@dbakti7
Copy link
Author

dbakti7 commented Jan 17, 2020

Hi @mknyszek

What is the peak memory use for your application? (Either VmHWM from /proc//status or whatever Prometheus tells you is the peak HeapAlloc recorded for your application.)

Full printout of /proc/<id>/status: https://pastebin.com/u0awpuUA
Prometheus: https://pastebin.com/wFVFGBCu
Note: at the point of this collection, VIRT reported by top is 4.86G and RSS is 3.92G

Linux kernel version.

3.10.0

Linux overcommit settings (cat /proc/sys/vm/overcommit_memory and cat /proc/sys/vm/overcommit_ratio).

overcommit_memory: 1
overcommit_ratio: 50

Is swap enabled on your system? If so, how much swap space do you have?

No

PS. On production, we are still using golang 1.9.4

@cupen
Copy link

cupen commented Mar 29, 2020

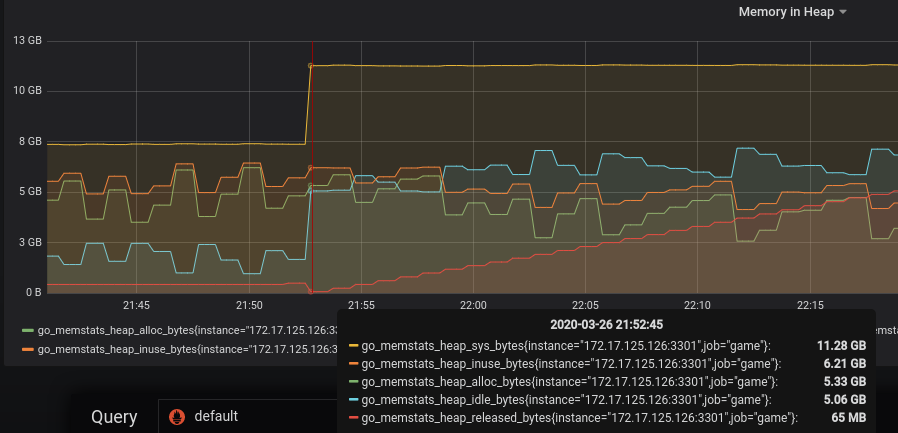
I meet the same problem. I check it by pprof, inuse_space goroutines, it's ok. no memory leaks. But RSS still keep increasing, and cause OOM finally.
It‘s strange that idle_bytes increasing a lot, but not return to the OS.

BTW: I'm using go1.13.7 and go1.14.1. The env var GODEBUG=madvdontneed=1 does'nt works for me. It‘s tested on go1.13.7 and go1.14.1.

here is my monitor(promethues) chart.
image

image

image

@mknyszek
Copy link
Contributor

@dbakti7 Sorry about the very long delay in coming back to this. I don't have a good handle on what could be going wrong. Everything you've shared with me thus far suggests that things are working OK on the Go side. Did GODEBUG=madvdontneed=1 help at all? Also, you mentioned that RSS keeps increasing; do you have a graph that shows the problem leading up to an OOM? How much memory do you have available on your system? Also, how much memory is Go 1.9.4 using in comparison?

@cupen That looks to me like you have a heap spike at around 21:53 and the service is slowly recovering (note heap_released increasing). It doesn't look to me like memory usage is increasing in your graphs. Is the actually RSS (I'm not sure how your setup works, but maybe memory_usage_in_bytes is what you want) growing over time, or is the OOM the result of transient heap spike? I believe you that an OOM happens, but I'm not convinced it's the same problem @dbakti7 is having. You may want to file a separate issue.

@mknyszek
Copy link
Contributor

@dbakti7 Actually, looking back, it occurs to me that since you're on Linux 3.10.0, which doesn't have MADV_FREE, that's almost certainly not the problem (and GODEBUG=madvdontneed=1 won't do anything). If MADV_FREE isn't available, we fall back on MADV_DONTNEED.

@cupen
Copy link

cupen commented Apr 4, 2020

@markdryan The actually RSS was similar as the heap_sys_bytes, it's much bigger than heap_inuse_bytes. The heap_released increasing, but RSS not decreasing.

About GODEBUG=madvdontneed=1 .
Thanks. I see why it's not works for me, my production OS was centos7.4+kernel 3.10. ;p

As you said, I will file a new issue for my problem.

@yousong
Copy link

yousong commented Jun 23, 2020

According to rpm -q --changelog kernel, the kernel package had "madvise: support madvise(MADV_FREE)" since 3.10.0-905.el7

@dbakti7
Copy link
Author

dbakti7 commented Jun 23, 2020

@mknyszek really sorry for missing to reply.
Unfortunately we are not allowed to try with madvdontneed in our production environment.
In one of our service containers, memory usage stabilized after RAM was increased (RSS still high, but no OOM at least). --> For this service, memory was increased from 5GB to 8GB, RSS now is hovering around 7GB+.

So maybe you are right about our service having "high memory peak usage".
So now we are focused in trying to optimize our memory allocations to lower the peak.
In addition, we are upgrading to go 1.13 (soon). I will update if problem still persists after these multiple optimizations.

@davecheney
Copy link
Contributor

@dbakti7

Unfortunately we are not allowed to try with madvdontneed in our production environment.

Can you explain why? If we understood the concerns, perhaps an alternative solution can be found.

@dbakti7
Copy link
Author

dbakti7 commented Jun 24, 2020

@davecheney no specific technical reason, it's more due to limitations imposed by our company policy in terms of data centre operations, i.e. no custom command is allowed in production environment.
Therefore we decided to investigate and optimize our memory allocations instead. It did reduce the peak RSS in our lab environment, now we are waiting for production update to validate it.

@davecheney
Copy link
Contributor

davecheney commented Jun 24, 2020

It's not a custom command, it's an environment variable, like JAVA_HOME.

@dbakti7
Copy link
Author

dbakti7 commented Jun 24, 2020

Sorry if I used the wrong terminology. Basically we have a very strict requirements in making changes to any thing in production environment (including setting environment variable). It requires strong evidence and reasoning from developers.
Since we are unable to replicate the OOM crash in lab, we can't provide the straightforward evidence so far for madvdontneed.

theoretically, madvdontneed should improve our situation further (refer to my original post where I provided the synthetic code)

Tried with GODEBUG=madvdontneed=1, result is better, but RSS still hovering at around 500MB, only when we combine madvdontneed with debug.FreeOSMemory() then we got RSS < 30MB. Is this the only way to ensure Go is returning memory back to OS in Linux?

@davecheney
Copy link
Contributor

Thank you for your reply. I have nothing further to add, but I encourage you to review this comment by @randall77 #39779 (comment)

@dbakti7
Copy link
Author

dbakti7 commented Jun 24, 2020

@davecheney Thank you for additional references. I'm pretty convinced with that statement now about how Go runtime works after multiple experiments. I'm okay to close this issue actually, until we found new information in the future.

But I have one (slightly off-topic) question, if I may:
Recently we are also trying to port our service to kubernetes environment. With exactly the same linux kernel version and Go version, we observe that our service seems to always returns back memory immediately (i.e. RSS remains low, any increase is accompanied by decrease almost immediately).
Which is a very different behavior as compared to when service is running in non-kubernetes environment.
I haven't trace further on this finding, but is there any obvious explanation that maybe you can think of?

@davecheney
Copy link
Contributor

I would inspect the overcommit settings for the respective kernels, the amount of swap configured, if any (linux behaves very differently in the presence of any amount of swap, even if it not used), and the respective memory loads of the machines--as @randall77 observed it is the decision of the kernel to seek to take back pages from a processes' working set based on overall memory pressure.

@aclements
Copy link
Member

Containers/cgroups also have a lot of memory controls, which Kubernetes could be configuring differently than your previous non-Kubernetes containers (it sounds like you were already running in containers, just not containers managed by Kubernetes?). In particular, I think a lower memory.soft_limit_in_bytes will cause the kernel to release MADV_FREEd memory more aggressively, and there may be other settings that can cause that as well. Typically, these settings can be found in /sys/fs/cgroup/memory/X/memory.*, where X identifies the container, though I'm not sure how Kubernetes manages cgroup names.

@dbakti7
Copy link
Author

dbakti7 commented Jun 24, 2020

@davecheney @aclements thank you for the pointers, I will check on these.
and yes, apart from Kubernetes, we are using Virtuozzo containers.

@agnivade
Copy link
Contributor

agnivade commented Jul 6, 2020

@dbakti7 - just wanted to follow up on this. Is there anything else we can help with on this issue? It sounds like this needs further debugging from your end to properly categorize it as a bug in Go or not.

@agnivade agnivade added WaitingForInfo Issue is not actionable because of missing required information, which needs to be provided. and removed WaitingForInfo Issue is not actionable because of missing required information, which needs to be provided. labels Jul 6, 2020
@dbakti7
Copy link
Author

dbakti7 commented Jul 6, 2020

Hi @agnivade!
Apology that I forgot to close the issue. I already got all the necessary information and pointers from this discussion to debug further.
Will close the issue for now. Thank you for the help!

@dbakti7 dbakti7 closed this as completed Jul 6, 2020
@golang golang locked and limited conversation to collaborators Jul 6, 2021
Sign up for free to subscribe to this conversation on GitHub. Already have an account? Sign in.
Labels
FrozenDueToAge WaitingForInfo Issue is not actionable because of missing required information, which needs to be provided.
Projects
None yet
Development

No branches or pull requests

9 participants