runtime: long pauses STW (sweep termination) on massive block allocation #31222
Comments
|
To be clear, the reproducer is making a 3.2 GiB allocation which is going to take a while for the OS to fulfill. However, I dug into this a bit and I'm seeing ~1s pauses, sometimes with only ~50ms pauses. The 50ms pauses represent a lower bound for how fast the OS can give us back pages. The ~1s pauses actually come from the fact that we're zeroing the entire 3.2 GiB allocation, even though it just came from the OS. We have an optimization which avoids re-zeroing fresh pages, but unfortunately this optimization is conservative. For example, if a needzero span at the end of the heap is contiguous with the new 3.2 GiB allocation, then those two are going to coalesce, and the 3.2 GiB free space will be marked needzero, when really only the first N KiB of it actually needs to be zeroed. One way we could fix this is by making needzero a number, and if we can guarantee that only the first N KiB need zeroing, then we only zero that. If it's some weird swiss cheese of non-zeroed memory then we just assume the whole thing needs zeroing, rather than trying to keep track of which parts need zeroing. I'm not sure if this fix is worth it though, since future allocations would still have to go back and zero this memory anyway, causing the 1s delay to return. |
|
For 1.15, one of my planned follow-up tasks on non-cooperative preemption is to make memclrNoHeapPointers preemptible. For large pointer-free allocations, this should make the long zeroing operation preemptible. |
|
In case others are wondering if they are running into this: |
|
I just encountered a >1s GC pause scenario, any suggestions on how to avoid the long pause?
|
|
@changkun Is that with Go 1.17? Zeroing some large allocations is now preemptible, if you suspect that's the problem here. 1 second is quite a while. Is this reproducible? Can you get a GC trace where this GC happens? That would help in narrowing down the source of the pause (that is, which part of the cycle it happened). Even if it doesn't show up in the trace (like, this is about trying to stop the world, not actually having the world stopped) that's still useful information. |
|
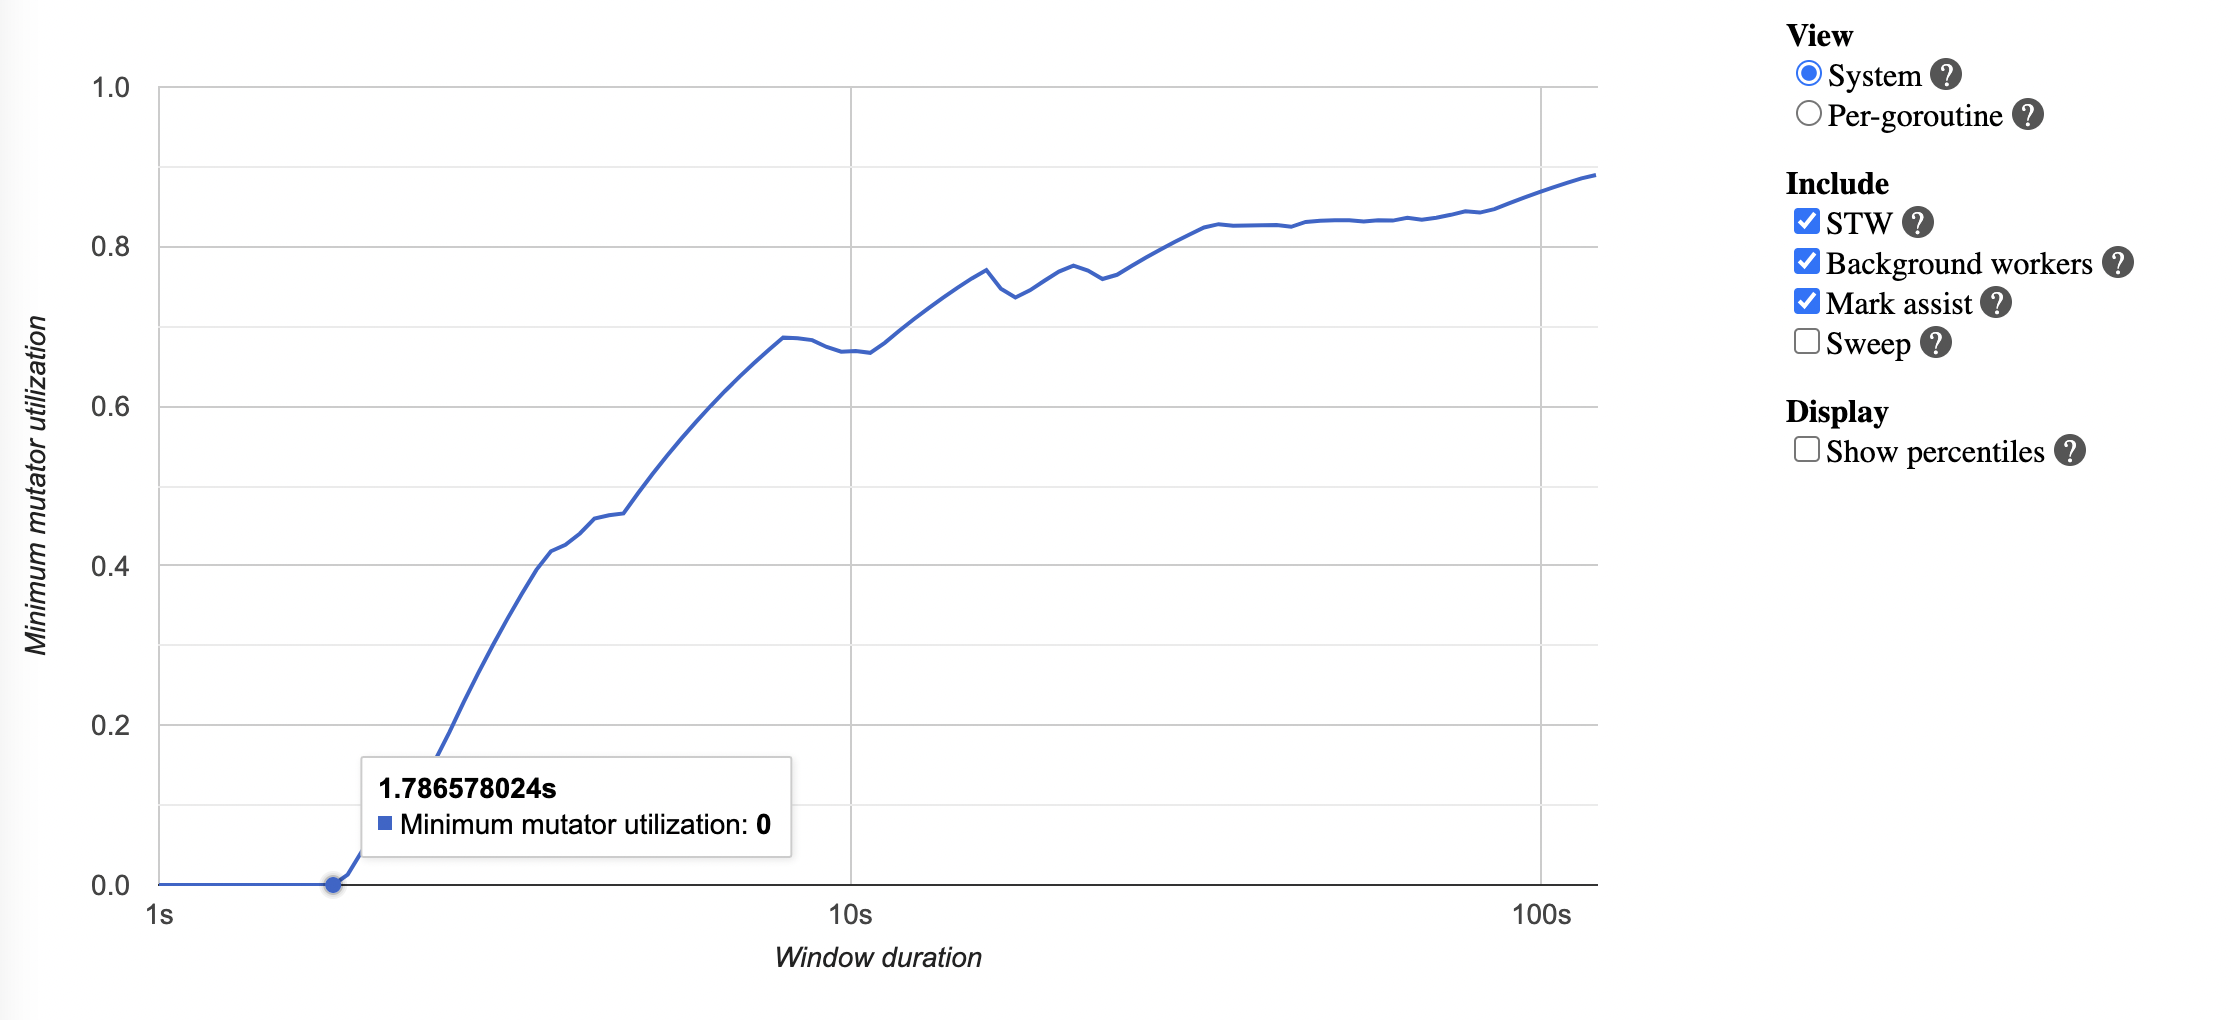
I am using a tip version The GC pause reported by Examples: GC idle took 0.02 second:
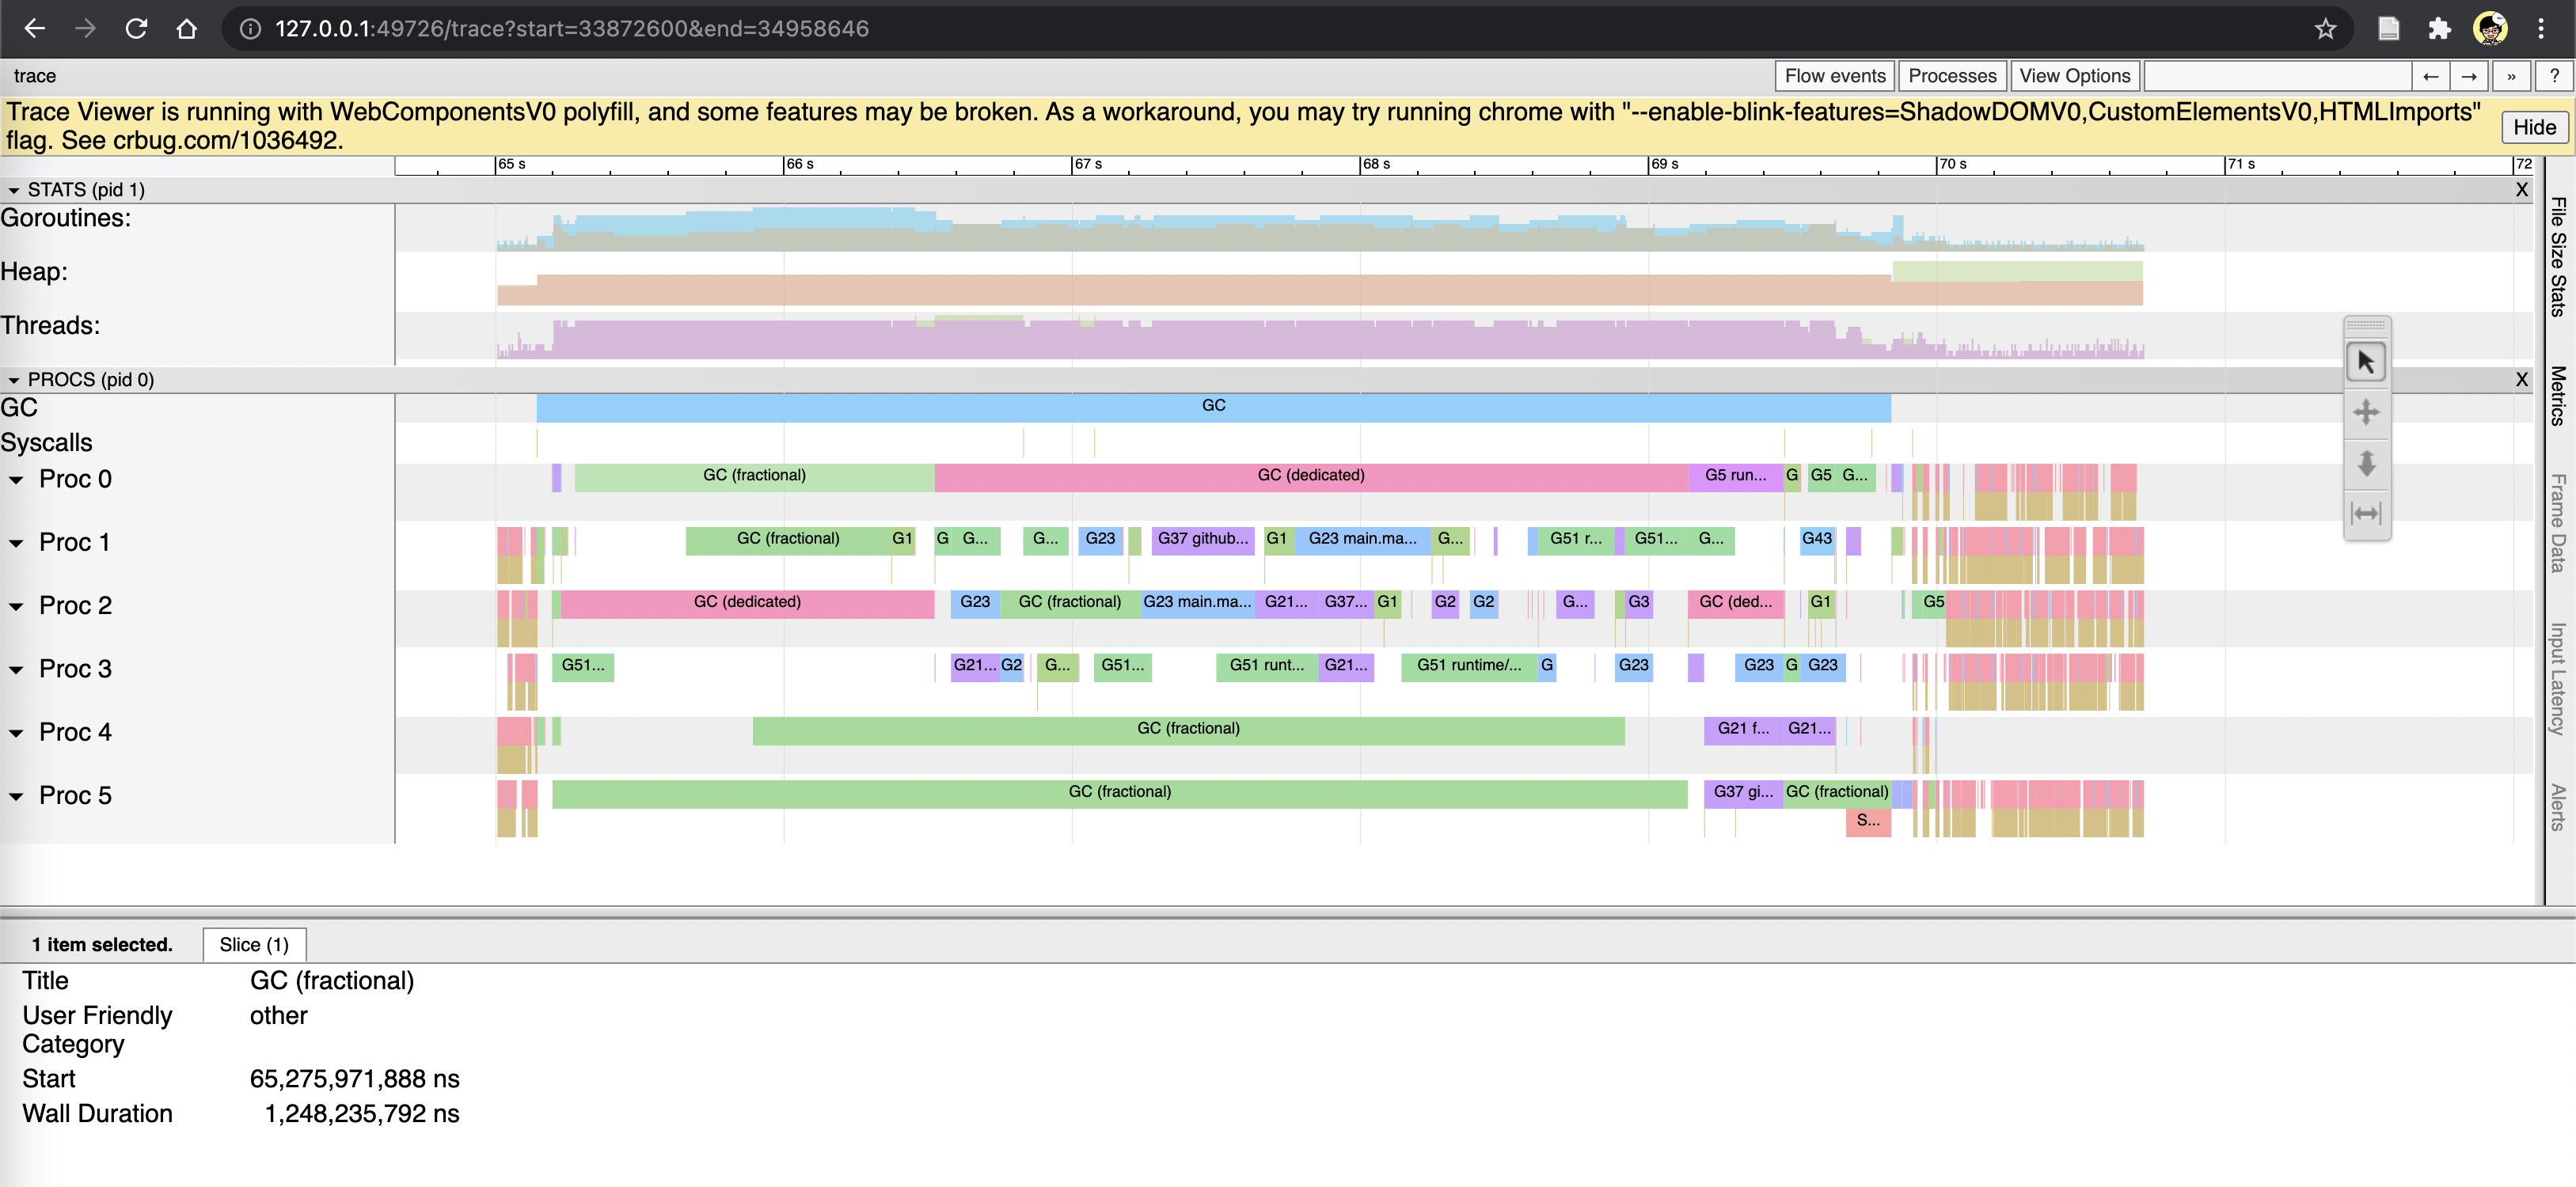
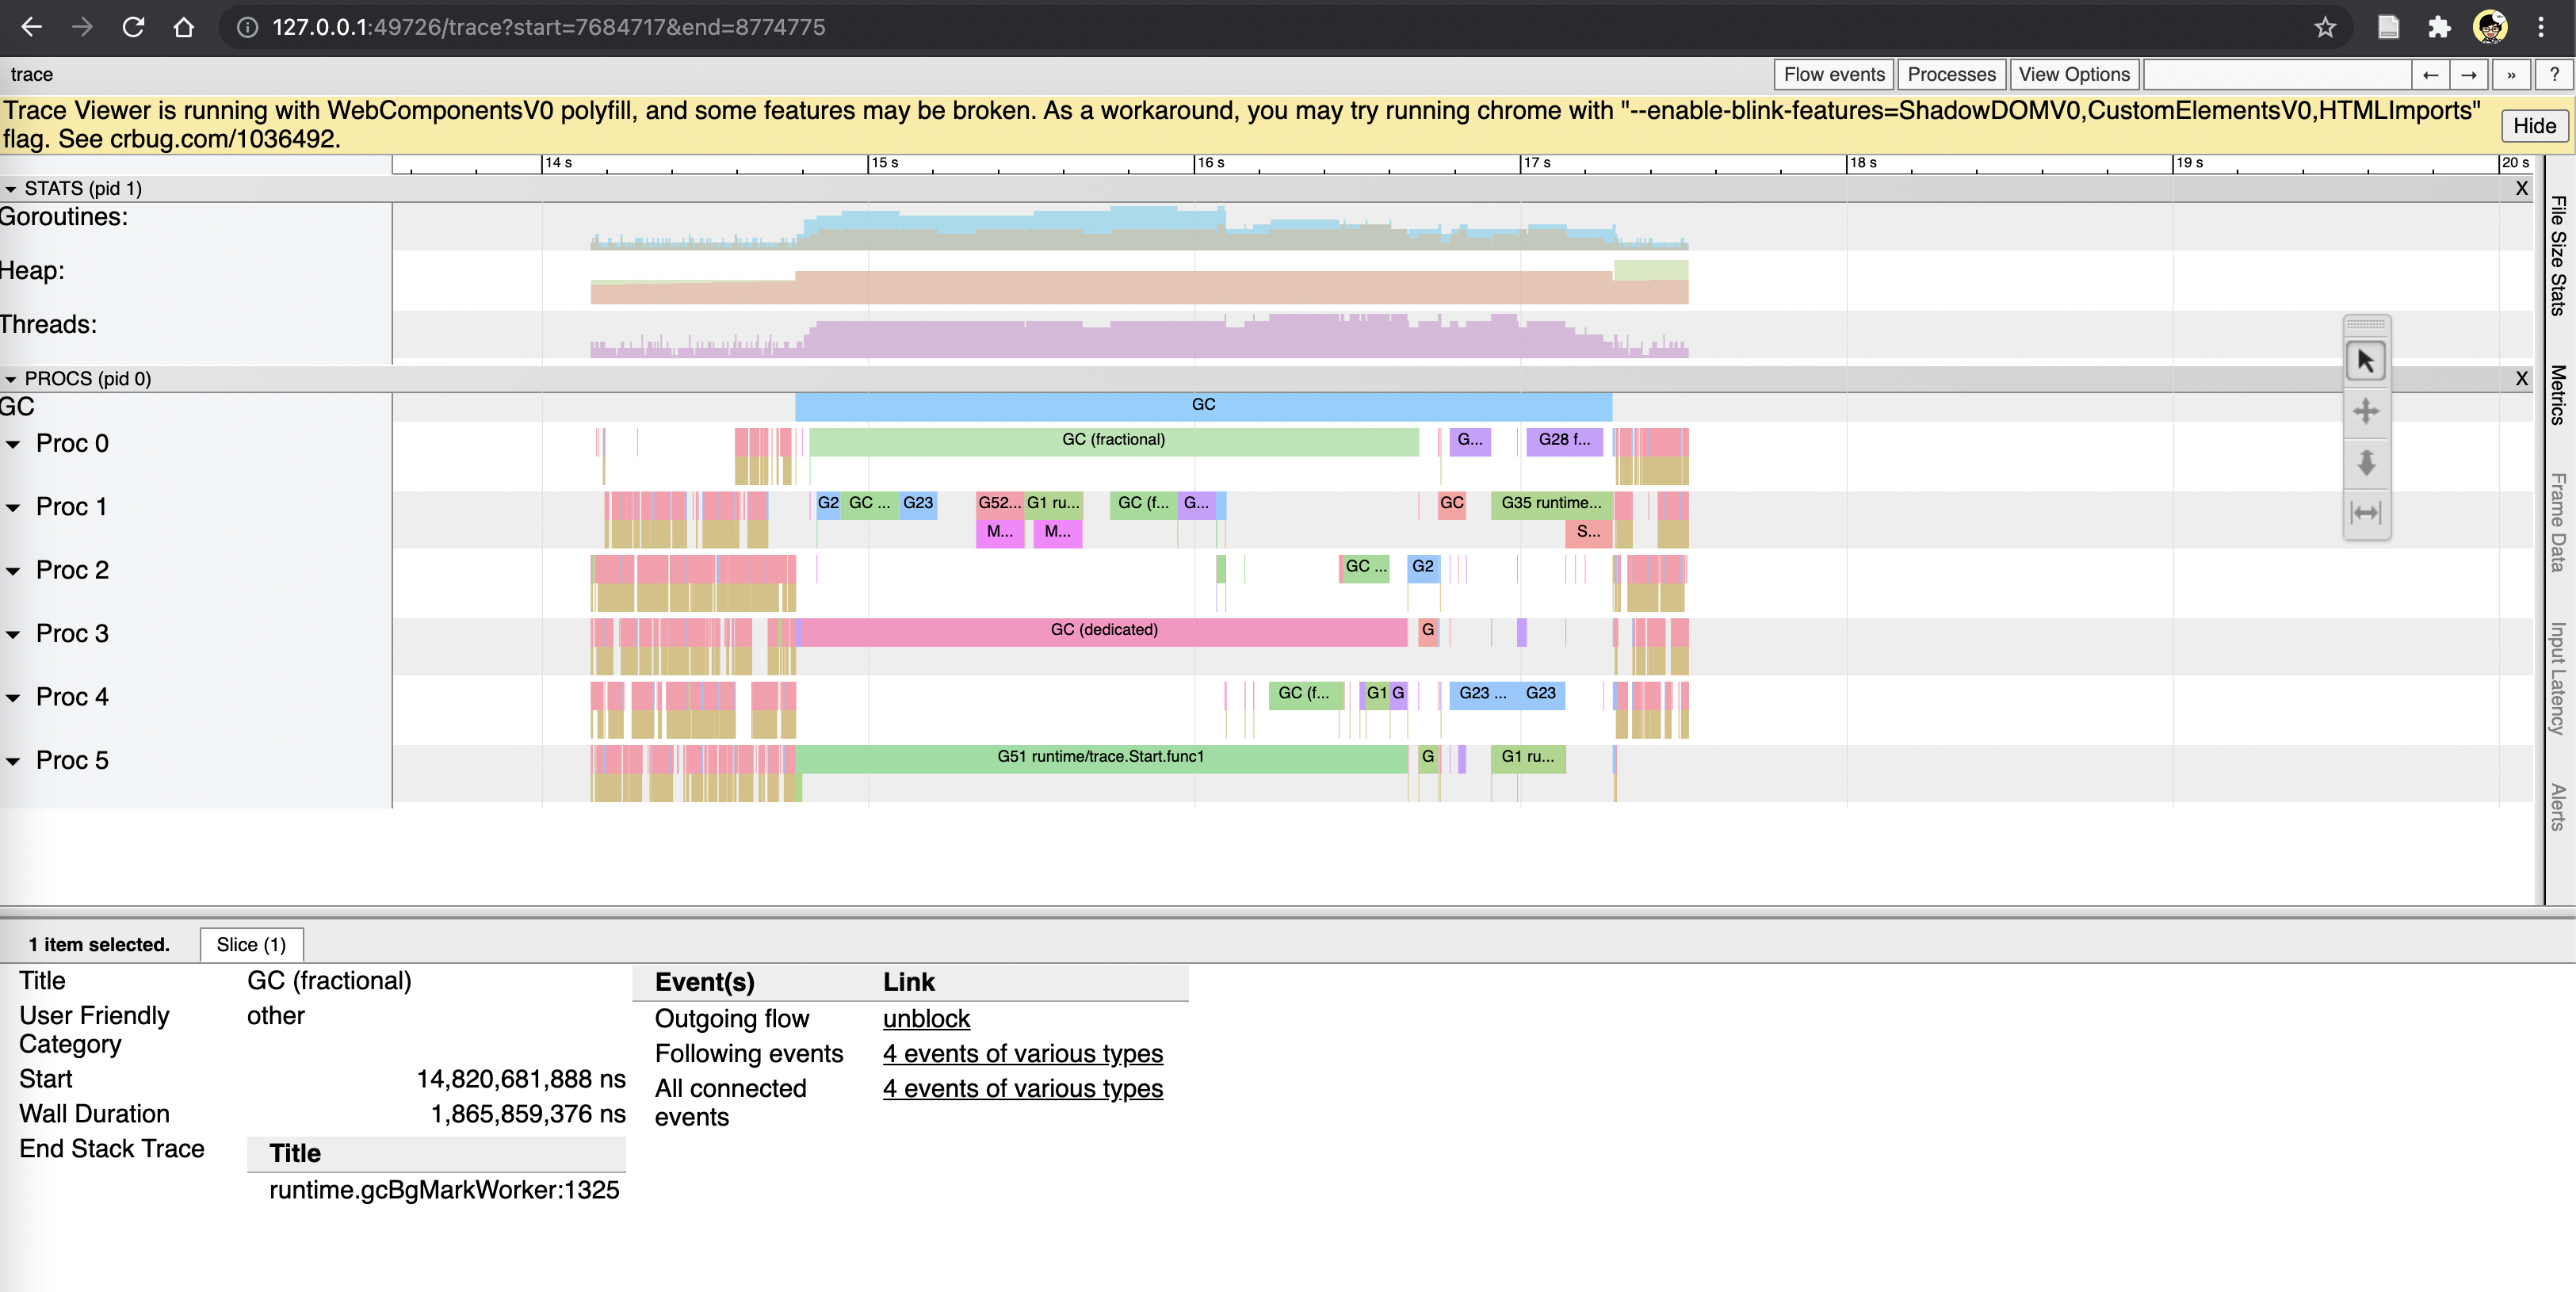
GC fractional took 1.2 second and 1.8 second:
Sweep termination took 1.8 second:
I hope I found good examples, if not: there are more examples, see the trace profile: https://drive.google.com/file/d/1OaMruMiu8RWBXclQDRuf7MGDkzjkR4PP/view?usp=sharing I had a few running cases where the max observation was 4 seconds (didn't collect trace profile for this case, but the reproducer should be able to observe that again):
The reproducer (depend on develop branch f52dd5f2461b4b6396df83a6a723037f74a75a72): package main
import (
"image/color"
"time"
"fyne.io/fyne/v2"
"fyne.io/fyne/v2/app"
"fyne.io/fyne/v2/canvas"
"fyne.io/fyne/v2/container"
"fyne.io/fyne/v2/layout"
"fyne.io/fyne/v2/test"
"fyne.io/fyne/v2/widget"
)
func main() {
app := app.NewWithID("iosrend")
win := app.NewWindow("Some Window")
cells := make([]fyne.CanvasObject, 0, 80*25)
for i := 0; i < 80; i++ {
for j := 0; j < 25; j++ {
cells = append(cells, canvas.NewRectangle(color.RGBA{R: 255, G: 255, B: 255, A: 128}))
}
}
container := container.New(layout.NewGridLayout(25), cells...)
c := 0
b := widget.NewButton("START", func() {
for i := 0; i < 80; i++ {
for j := 0; j < 25; j++ {
index := i*25 + j
obj, _ := container.Objects[index].(*canvas.Rectangle)
if c == 0 {
obj.FillColor = color.RGBA{R: 20, G: 30, B: 100, A: 128}
} else if c == 1 {
obj.FillColor = color.RGBA{R: 100, G: 20, B: 30, A: 128}
} else if c == 2 {
obj.FillColor = color.RGBA{R: 30, G: 100, B: 20, A: 128}
}
obj.Refresh()
}
}
c = (c + 1) % 3
})
go func() {
tk := time.NewTicker(50 * time.Millisecond)
for range tk.C {
test.Tap(b)
}
}()
win.SetContent(fyne.NewContainerWithLayout(layout.NewBorderLayout(nil, b, nil, nil), container, b))
win.ShowAndRun()
} |


|
Thanks for the examples. The GC idle and fractional traces aren't STW, Something odd appears to be happening in the GC idle example you gave because only G37 is running for a long time; that may or may not be a runtime issue, but it wouldn't show up as pause time. The sweep termination trace, however, is STW. Do you know which of the traces you uploaded is that one? We'd need to look at the stack trace of G21 at the end of the STW to get a sense of where this is. From the screenshot, G21 is clearly doing some extremely long (~35 second?!) operation. |
@aclements , thanks for the follow-up. I wasn't unable (or patient enough) to open the slowly loaded huge trace file, but from the collected runtime/metrics, the data shows the largest STW was ~4s. From the traces, it seems that those areas are not working on more rendering work (issue GPU draw calls). Such a phenomenon is always surrounded by GC events, hence I had the assumption that it has some trouble to collaborate with GC.
Yes, you can download the trace file here: G21 suppose to do work in the application lifetime, except for a clear request. As the name of G21 revealed, it is a goroutine for an unbounded channel where the implementation is just a for loop that takes some input from the channel, append to a slice buffer, then send out if there is a receiver waiting. Here is the code: type UnboundedCanvasObjectChan struct { in, out chan fyne.CanvasObject }
func NewUnboundedCanvasObjectChan() *UnboundedCanvasObjectChan {
ch := &UnboundedCanvasObjectChan{
in: make(chan fyne.CanvasObject, 128),
out: make(chan fyne.CanvasObject, 128),
}
go func() {
q := make([]fyne.CanvasObject, 0, 1<<10)
for {
e, ok := <-ch.in
if !ok {
close(ch.out)
return
}
q = append(q, e)
for len(q) > 0 {
select {
case ch.out <- q[0]:
q = q[1:]
case e, ok := <-ch.in:
if ok {
q = append(q, e)
break
}
for _, e := range q {
ch.out <- e
}
close(ch.out)
return
}
}
if cap(q) < 1<<5 {
q = make([]fyne.CanvasObject, 0, 1<<10)
}
}
}()
return ch
}
func (ch *UnboundedCanvasObjectChan) In() chan<- fyne.CanvasObject { return ch.in }
func (ch *UnboundedCanvasObjectChan) Out() <-chan fyne.CanvasObject { return ch.out } |
|
Thanks. From the trace, I can confirm that this is a problem with This reflects the first preemption point after the non-preemptible operation. So it's a little hard to say exactly where this time is going in mallocgc, but we can tell it's from an append in NewUnboundedCanvasObjectChan (the one on line 47). Unfortunately, I think all this tells us is that this is the known issue with allocating large blocks of pointerful memory causing long non-preemptible regions. I am surprised it's a whole second, and that makes me wonder if there's something beyond zeroing the memory at play here. @changkun , do you know how large these slices get? What hardware are you running this on? |
|
@aclements Thanks again for the confirmation. If it is a known issue, is there is any known approach for a workaround? The unbounded channel code is for delivering draw operations. It is hard to know how large the slice is, but I can do a rough estimation: The code runs for about 20 seconds without GC running in the background. Assume the slice is cleared from the last GC and starts from zero sizes. There are at least 2000 pointer objects that must be appended into the slice, every 50 milliseconds. Hence 800,000 objects had been cached in the slice before sweep termination. If a pointer object is 16 bytes, then the entire slice should have roughly at least 12MB. The reproducer (in previous comments) was running on iOS 15, iPhone 12 Pro (without Max). |
|
Hmm. It definitely shouldn't take anywhere near that long just to zero 12MB. For lack of a better hypothesis, my best guess is that there's some unfortunate OS interaction involved, like it has to page in more memory for this process but to do that it has to shut down some other cached process (that's a total guess). In terms of workarounds, unfortunately the answer is to make smaller allocations. That might be a better code structure here anyway: you're effectively creating a deque, which is often implemented as a linked list of fixed-size blocks. That would limit each individual allocation and allow GC to more effectively reclaim memory. |
|
Fixed-size blocks is a nice structure but grow a little bit more complexity on the implementation of resizing there. Before doing it, I still wonder is why q := make([]*int, 0, 1<<10) // slice
for {
e, ok := <-ch.in
...
q = append(q, e) // (1) large alloc (?)
for len(q) > 0 {
select {
case ch.out <- q[0]:
q = q[1:] // (2) here
case e, ok := <-ch.in:
if ok {
q = append(q, e) // (3) large alloc (?)
break
}The previous assumption (~12MB) is really a worst-case scenario meaning that no receiver available in 20 seconds, which is entirely false, a real case should be better than than. The slice operation (in (2)) moves the head of the slice which removes the reference to previous elements. A large allocation in append means it will double an "already-huge" slice capacity. Hence it seems to suggest the slice for caching elements can only be GCed until very late. Is there a particular reason that GC does not collect the those unreferenced elements in the slice? |
The GC doesn't work in partial objects. That is, it doesn't track the "earliest" reference into a slice, just that there was some reference to the slice. And once the entire slice is retained by GC, it also retains everything it points to. One could certainly imagine GC tracking the earliest pointer into a slice and only scanning the slice past that point (in fact, you could do this for all objects). This gets really tricky when there are multiple references to an object. For example, the GC could have already followed one reference and scanned the object past that point, only to later find a reference that points earlier in the object and either have to scan it again or track the point in each object it last scanned from. It's all theoretically doable, but it wouldn't pay for its own costs in most cases. If you want GC to collect the unreferenced elements, set |
|
@aclements does runtime.mallocgc blocks the pre-emption in go1.18 ? We are observing a similar issue with long sweep termination phase. Allocation size is 32K - 64K. |
|
Just commenting since we're also seeing this issue on some services internally. The worst outliers can be up to 15s:
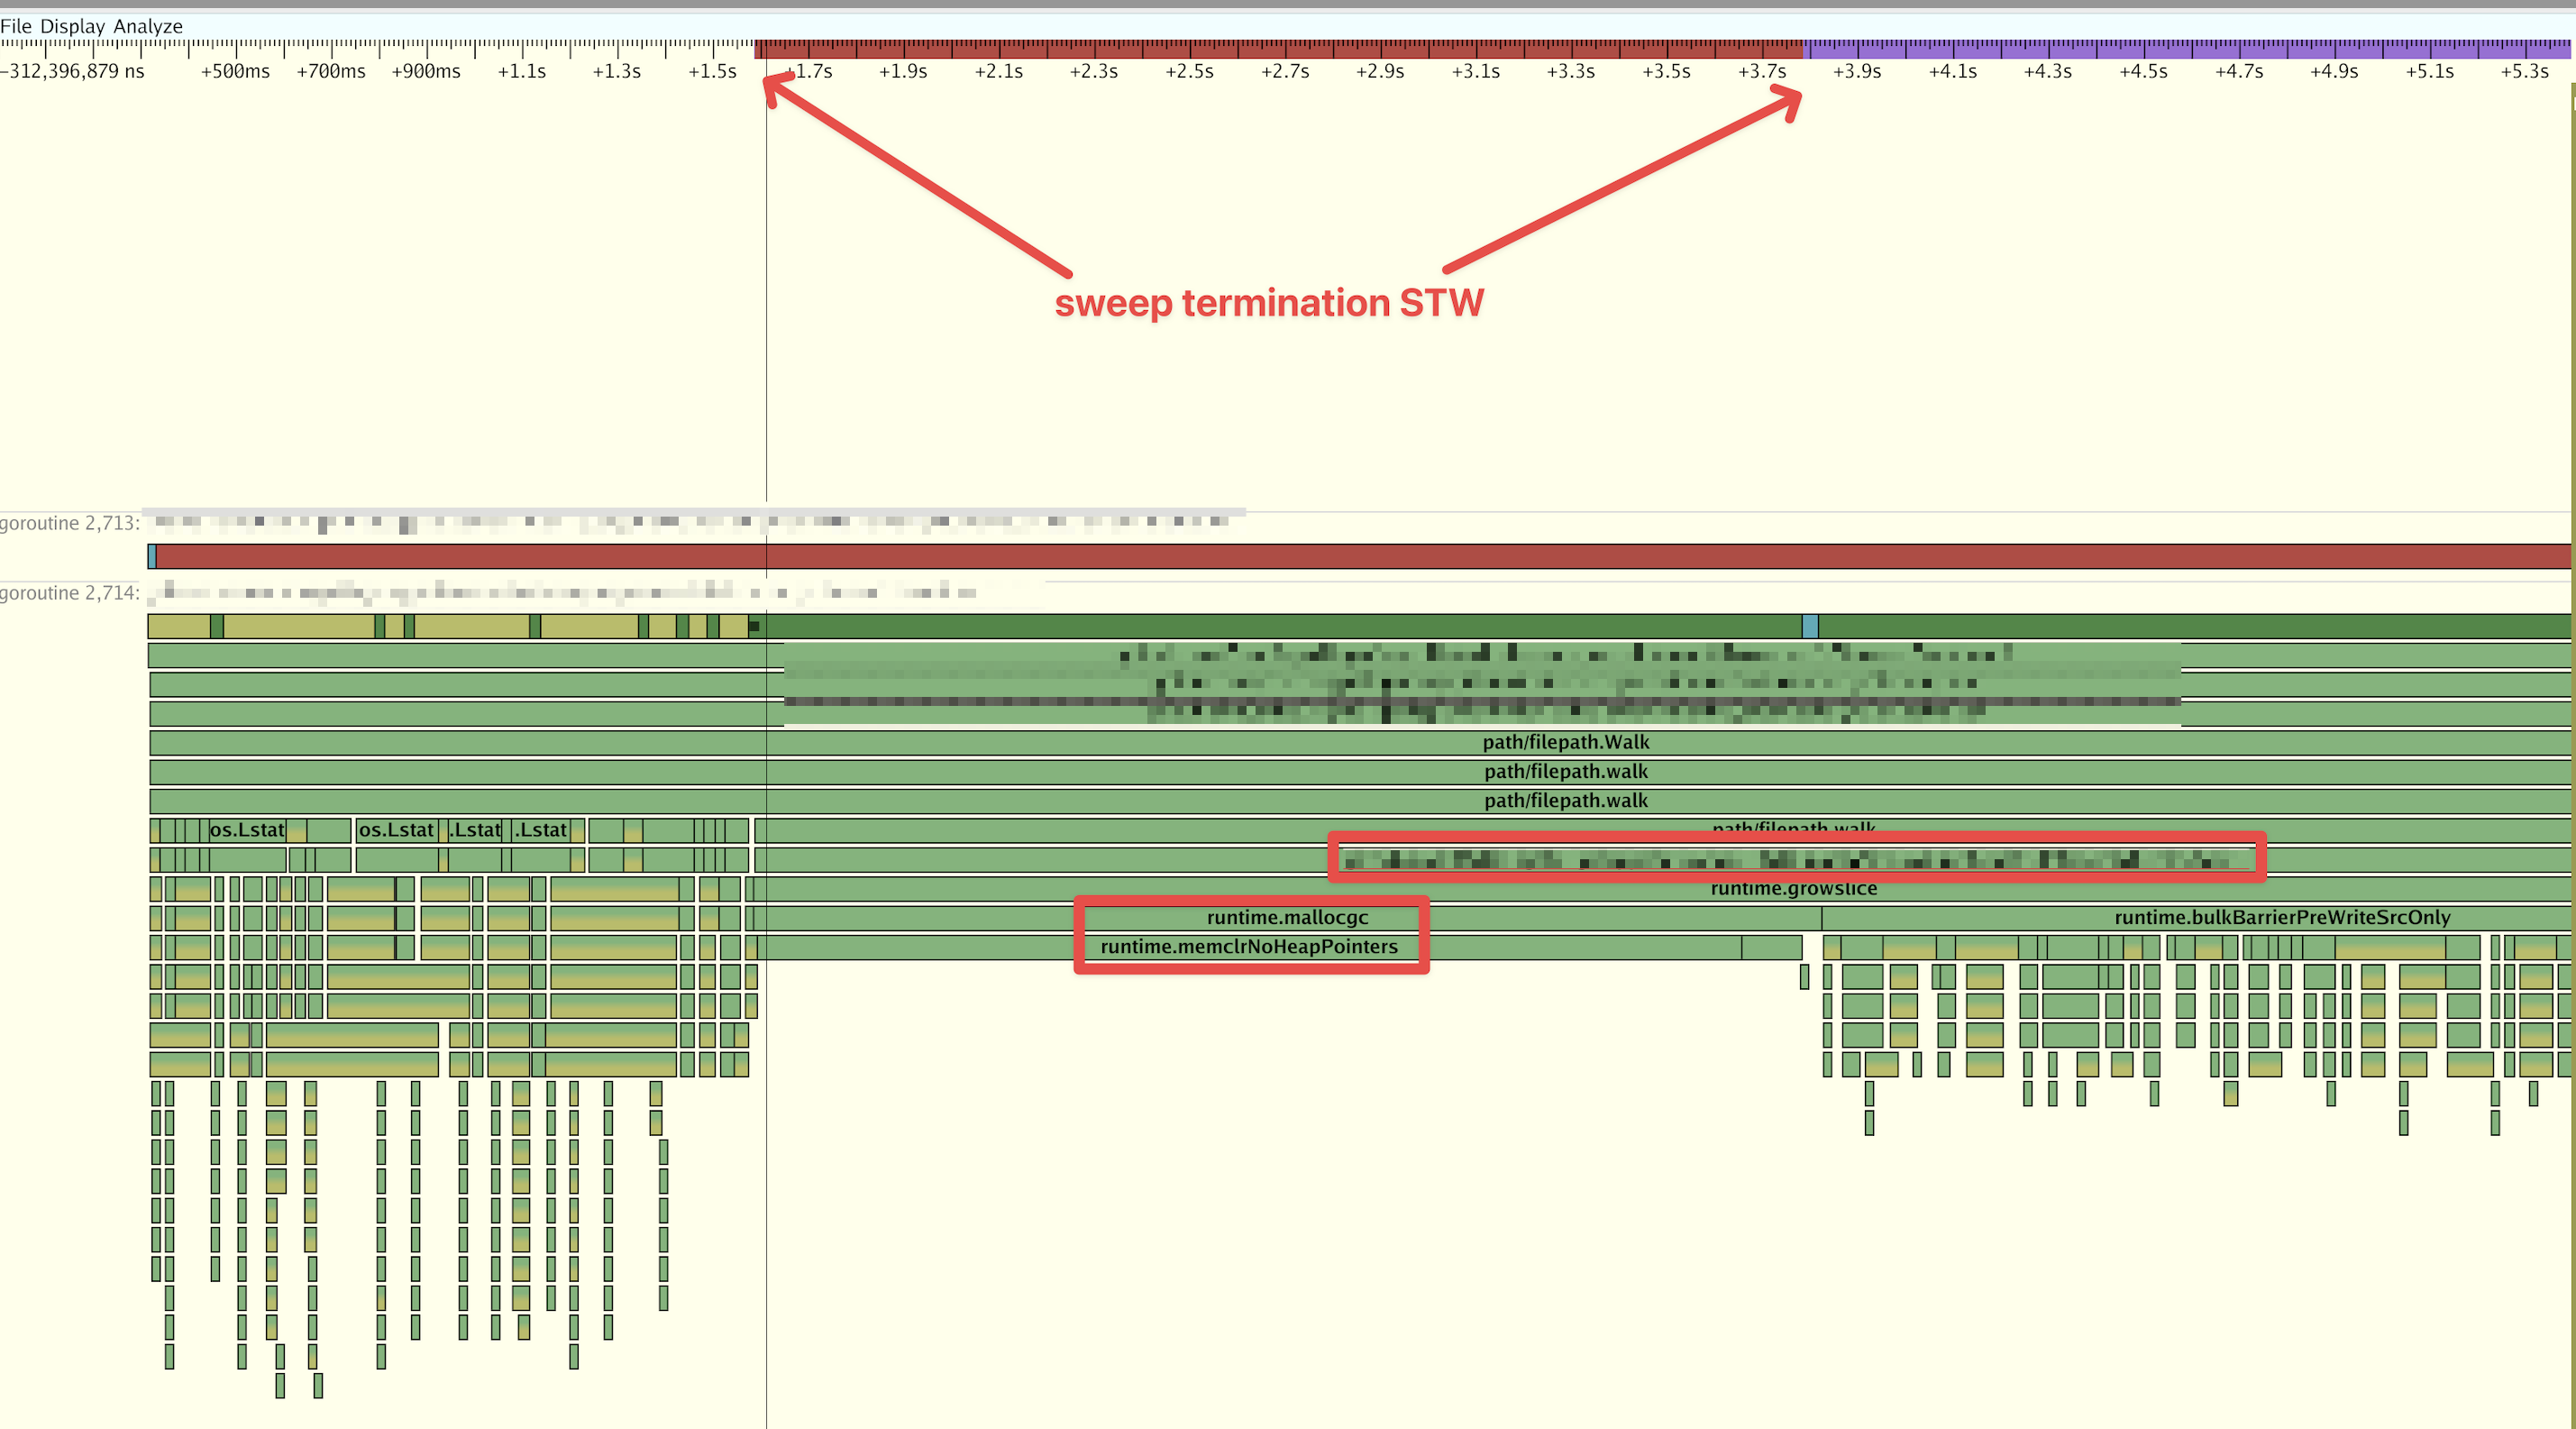
Here is some detail on a 2s pause we were able to catch while running an execution trace.
This isn't critical for us and we think we know how we could mitigate the problem by changing our code. I'm just commenting since it came up in a discussion with @prattmic today. My colleague @pmbauer did the investigation on this. |

|
I did some thinking about breaking up the zeroing of large pointerful objects. I think it's doable, but it's pretty subtle, and I might be missing something (there may be some GC interaction I'm not seeing, specifically). It would look something like this:
There's an additional detail here that we don't update freeIndex until the second non-preemptible section, I think. Setting the span as scannable late and non-atomically works because if it happens during a GC cycle (or if we transition into a GC cycle while zeroing) we'll mark the object before returning, so it'll never need to get scanned (and thus its class doesn't matter). STWs also effectively global memory barriers so GC transitions are safe. I think the only downside is how subtle this all is. |
|
One way to make the approach in my previous comment less complex would be to push more of the responsibilities of initializing heap spans up closer to The main benefit of this is it would significantly reduce the distance between where the span class is set for good and where the subtleties of it actually matter. Large object span setup (including zeroing) could then be pushed down into |
|
|
|
|
|
Also, I think it's too late in this cycle to do anything here for Go 1.21 unfortunately (clearing memory that will soon contain pointers is subtle) but I will do something here for 1.22 early-in-cycle. We've brainstormed a few ideas and I feel pretty OK about the idea of faking a span as noscan until its' allocation is ready to be returned. We already do this kind of faking elsewhere, so we're at least not adding too much new complexity. |
|
Oh interesting; thanks you for the rapid clarification! Now I need to go back to debugging the application a bit more, since there is something happening I don't understand... |
|
It is my understanding that when the kernel returns a block of zeroed memory all the virtual addresses point to a single physical write protected page of zeros. The first write to a page ends up allocating a physical page, zeroes it, and associates the virtual memory to the physical memory. This copy (or zero) on write greatly reduces the latency of asking for zeroed memory and then does the zeroing incrementally on demand when the page is written to. Can we mimic this approach for large allocations? I suspect it can’t be done in user space but perhaps we can round trip the memory to the kernel so when it returns it works like fresh memory. If this works then the problem with allocating, deallocating, and reallocating large objects will also see reduced latency. I have no idea how large of an allocation would be needed for this to be a win. |
|
That's an interesting idea. You can force this via But, for larger allocations that need to be zeroed anyway, it might not actually matter (or, the latency win far outweighs any throughput loss). This could be a much simpler and safer way to achieve the latency improvement vs. the chunking approach. Thanks for the suggestion Rick! The one downside is I don't think a similar approach will work on non-Linux platforms. For instance, the comparable mechanism on Windows does actually cause a fault. On the BSDs there's only |
|
This issue is currently labeled as early-in-cycle for Go 1.22. |
|
This is going to be a good bit easier to do with the new allocation headers landing in Go 1.22. Punting to Go 1.23, but this time for sure. :) |
|
This issue is currently labeled as early-in-cycle for Go 1.23. |
|
Change https://go.dev/cl/577495 mentions this issue: |
What version of Go are you using (
go version)?What operating system and processor architecture are you using (
go env)?go envOutputWhat did you do?
We have a big entity cache inside an application. So it's loading in background goroutine.
And when the application allocates a slice in the background the latency inside all response handlers increases.
Got a reproducer
What did you expect to see?
Worker gorotine(loop in example) should not pause more than 1-5ms.
What did you see instead?
43ms pauses
The text was updated successfully, but these errors were encountered: