Skip to content
New issue

Have a question about this project? Sign up for a free GitHub account to open an issue and contact its maintainers and the community.

By clicking “Sign up for GitHub”, you agree to our terms of service and privacy statement. We’ll occasionally send you account related emails.

Already on GitHub? Sign in to your account

cmd/trace: generate trace graph for custom region selection #30895

Open
AlexRouSg opened this issue Mar 18, 2019 · 17 comments
Open

cmd/trace: generate trace graph for custom region selection #30895

AlexRouSg opened this issue Mar 18, 2019 · 17 comments

Comments

@AlexRouSg
Copy link
Contributor

I propose that cmd/trace should have an option in the web UI to generate a trace graph for an arbitrary list of user defined regions.

I want/need to see the timing between certain user defined regions and having such an option in the web ui would be very useful. I could just dump them all into the same task but this means recompiling the program and changing code just to change what regions get shown together. Also if the program failed to call task.End() for any reason, then the trace graph doesn't get generated at all.

@gopherbot gopherbot added this to the Proposal milestone Mar 18, 2019
@ianlancetaylor
Copy link
Contributor

CC @hyangah @pjweinbgo

@bcmills
Copy link
Contributor

bcmills commented Apr 12, 2019

CC @ianthehat

@bcmills bcmills added the NeedsDecision Feedback is required from experts, contributors, and/or the community before a change can be made. label Apr 12, 2019
@rsc
Copy link
Contributor

rsc commented Apr 24, 2019

The actual viewer UI is part of Chrome DevTools (now Catapult) and is taken from upstream.
The bare-bones web pages around it are generated by cmd/trace, and we could do filtering in those before invoking the DevTools. But how would the regions get defined? That is, how would you express to the tool which regions to keep in the filtered trace?

@AlexRouSg
Copy link
Contributor Author

Was thinking of a multi list selector in the web UI but if that's too much, I guess a command line arg would be good enough.

Maybe go tool trace -with-regions <Task>/<Region> <No task region> <Region from any task> trace.out
Then it generates a trace graph with those regions and maybe put it under localhost/traceregions

@ianlancetaylor
Copy link
Contributor

How is a region defined? Can you give a specific example of the -with-regions argument?

@AlexRouSg
Copy link
Contributor Author

AlexRouSg commented Apr 24, 2019

When I say "regions" I meant trace regions users defined by using runtime/Trace

e.g.

package main

import (
	"context"
	"fmt"
	"runtime/trace"
)

func Example() {
	trace.WithRegion(context.Background(), "foo", func() {
		fmt.Println("foo")
	})

	ctx, task := trace.NewTask(ctx, "awesomeTask")
	trace.WithRegion(ctx, "bar", func() {
		fmt.Println("awesomeTask/bar")
	})

	task.End()
}

And then you execute go test -trace=out.trace && go tool trace -with-regions="awesometask/bar foo" out.trace if a task isn't specified then it pulls in all regions matching the name from any task.

@rsc
Copy link
Contributor

rsc commented May 7, 2019

@hyangah and @pjweinbgo, does the command line option in the comment above this one seem reasonable? Also is it implementable? Thanks.

@hyangah
Copy link
Contributor

hyangah commented May 8, 2019

@AlexRouSg can you elaborate what information you want to see from the output visualization?

  • Do you want to see other activities such as goroutines, P assignment, and syscalls associated with the specified task/region?

  • Or do you just want to see only the task/region timing info (nothing other than that)?

  • What specific visualization options(trace? goroutine? ...) do you want to be altered?

  • What do you mean by "localhost/traceregions" here?

Maybe go tool trace -with-regions <Task>/<Region> <No task region> <Region from any task> trace.out
Then it generates a trace graph with those regions and maybe put it under localhost/traceregions

@AlexRouSg
Copy link
Contributor Author

Do you want to see other activities such as goroutines, P assignment, and syscalls associated with the specified task/region?

Or do you just want to see only the task/region timing info (nothing other than that)?

What specific visualization options(trace? goroutine? ...) do you want to be altered?

Like what you get when you go to http://127.0.0.1:49854/trace?taskid=1#0:1284.290663 but instead of seeing events for the selected task, you see events for a selected list of regions that may or may not be in the same task or have a task.

What do you mean by "localhost/traceregions" here?

The URL for accessing the graph. I don't really care about this part.

@rsc
Copy link
Contributor

rsc commented Jul 2, 2019

@hyangah and @pjweinbgo, does this seem like something that can be implemented? I'm not asking you to implement it, just to weigh in on whether it makes sense to accept as a path forward. Thanks.

@hyangah
Copy link
Contributor

hyangah commented Jul 2, 2019

@rsc I don't think I fully understand the proposed feature even though I agree that cmd/trace needs more love. Sketch of the desired visualization, or concrete examples may be helpful.

@AlexRouSg
Copy link
Contributor Author

Does this help?

new

@hyangah
Copy link
Contributor

hyangah commented Jul 2, 2019

@AlexRouSg why not just implementing an handler in the server-side, take the region name or regexp as a text input field, and pass it to the handler? (instead of the command line flag).

The visualization needs to be careful when handling the case where there are so many matching regions and tasks.

@AlexRouSg
Copy link
Contributor Author

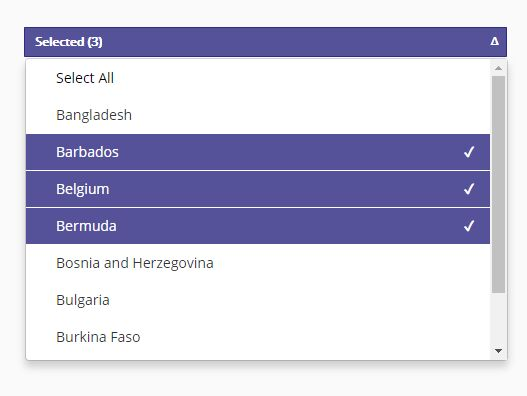
I originally wanted a multiselect thing on the webpage, something like:
image

But thought that was too much so the command line was an alternative way to get the list to the handler.

@hyangah
Copy link
Contributor

hyangah commented Jul 2, 2019

command line requires reparsing of the trace. I think a simple text input box would be good enough.

@AlexRouSg
Copy link
Contributor Author

I'm fine with a textbox

@rsc
Copy link
Contributor

rsc commented Jul 16, 2019

It sounds like there is an agreement here about a text input box for selecting the trace subsection. I will mark this as accepted but I don't think we plan to do it any time soon. Help welcome.

@rsc rsc modified the milestones: Proposal, accepted Jul 16, 2019
@rsc rsc removed this from the accepted milestone Jul 16, 2019
@gopherbot gopherbot removed the NeedsDecision Feedback is required from experts, contributors, and/or the community before a change can be made. label Aug 16, 2019
@rsc rsc changed the title proposal: cmd/trace: generate trace graph for custom region selection cmd/trace: generate trace graph for custom region selection Aug 5, 2022
@seankhliao seankhliao added this to the Unplanned milestone Aug 20, 2022
Sign up for free to join this conversation on GitHub. Already have an account? Sign in to comment
Projects
None yet
Development

No branches or pull requests

7 participants