cmd/pprof: Feature: profiling support for regular tests #23811
Comments
|
The -cpuprofile flag should work with Test* functions and there is no need to change them to be Benchmark functions. One caveat is that if the test function ends very quickly, it's possible that the execution is not sampled at all. (The current cpu profile rate is 100Hz.) Maybe that's why renaming Test functions to Benchmark functions cause to capture the samples - benchmark framework may call the benchmark functions multiple times under the hood, so some samples are captured. |
|
With Exact command: go test \
-timeout 20m \
-v \
-coverprofile="coverage-\${pkg//\//-}.out" \
-cpuprofile cpu.prof -bench . "\$pkg"; |

|
The -bench flag used in the profile makes only Benchmark* functions run. |
|
@hyangah have you tried it yourself? I get the exact same empty output with this command: go test \
-timeout 20m \
-v \
-coverprofile="coverage-\${pkg//\//-}.out" \
-cpuprofile cpu.prof "\$pkg";The tests are non-trivial, many of which take a few seconds to run. |
|
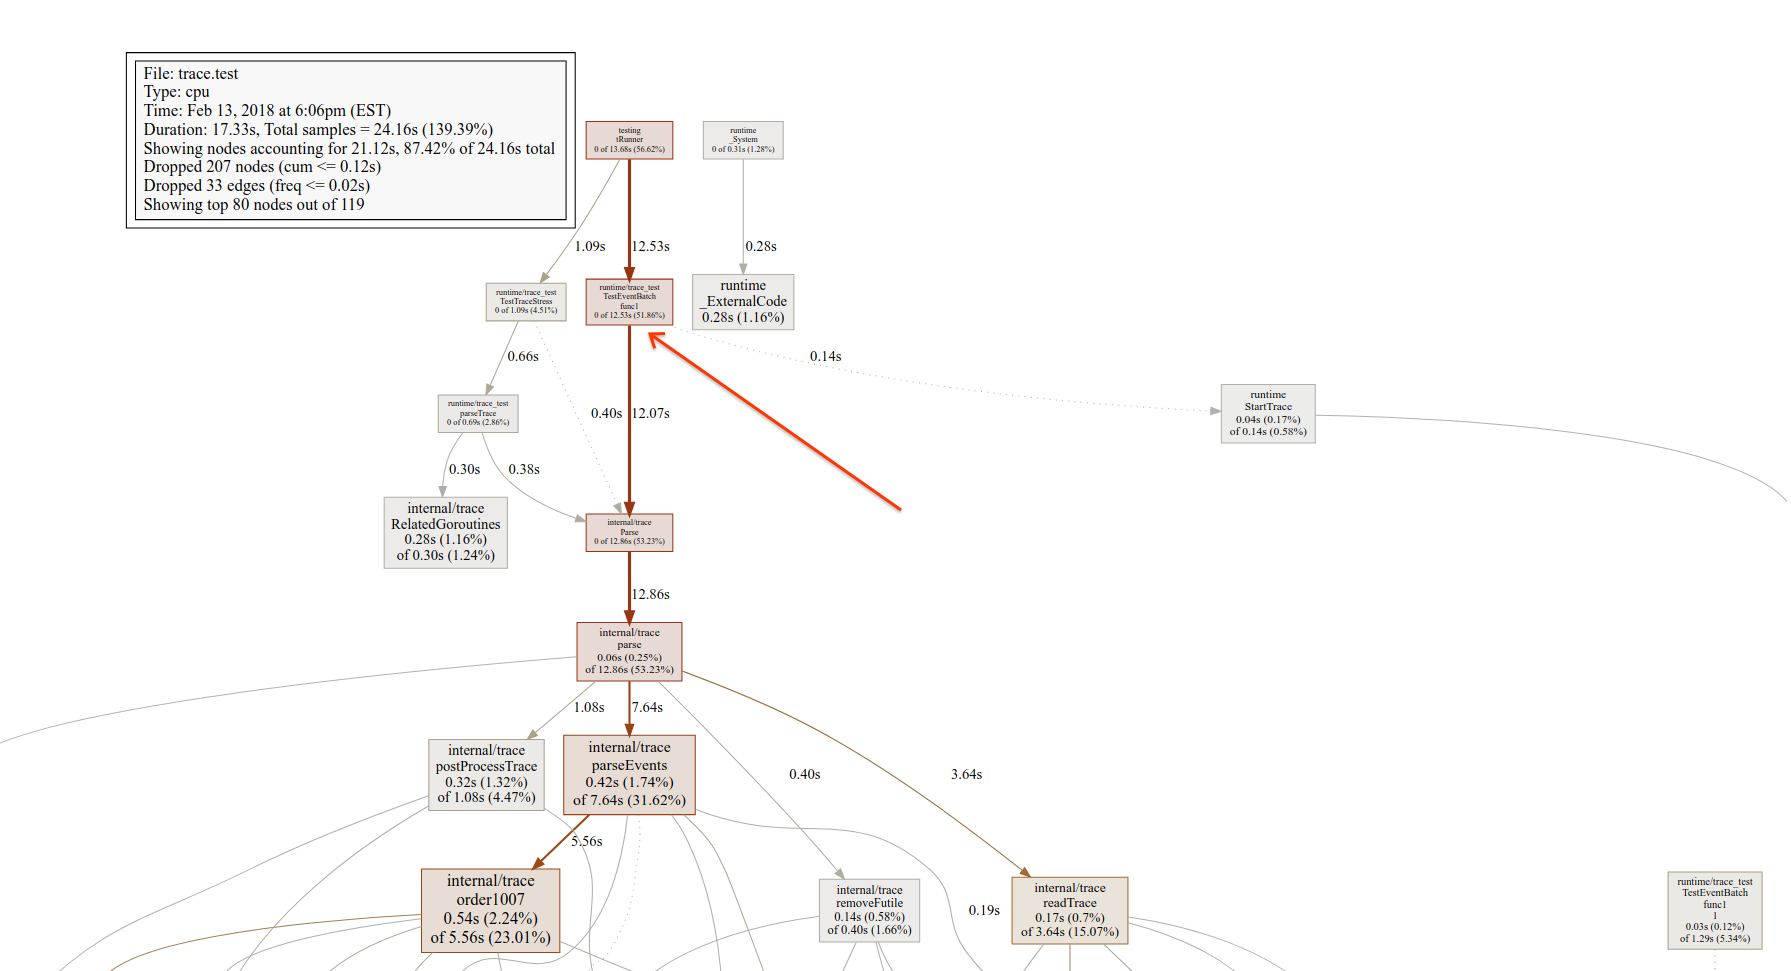
Yes, here is the profile output from tests in src/runtime/trace |
|
The .prof file was being overwritten by another .prof for a package with no tests. |
It would be great if I could profile tests (or code in general) without having to write new code.
Currently, to profile tests via
-cpuprofile, I have to contort my tests to get picked up by the profiler. I have to change allTest*functions to be calledBenchmark*. To do so, I run something like this:Clearly not ideal.
However, the output that this generates is exactly what I'm looking for. The function graph is perfectly generated as I would expect. It would be great if I could easily profile tests without jumping through hoops.
Thanks for considering!
The text was updated successfully, but these errors were encountered: