cmd/trace: surprising Threads "InSyscall" count #22574
Comments
|
It seems it is related to runtime changes in managing timerproc. For InSyscall stats, three trace events types are involved. GoSysBlock, GoInSyscall, and GoSysExit. The first two increment the counter, and the GoSysExit decrements the counter. from Tip: > go test -cpu 4 -run TestTCPServer -trace /tmp/tip.trace > go tool trace -d /tmp/tip.trace | grep Sys | grep -v SysCall 376494 GoSysBlock p=3 g=50 off=36115 409851 GoSysBlock p=2 g=34 off=23368 583289 GoSysExit p=1000003 g=34 off=413 g=34 seq=4 ts=173541978068605 594011 GoSysBlock p=0 g=34 off=431 637888 GoSysExit p=1000003 g=34 off=439 g=34 seq=6 ts=0 639079 GoSysBlock p=0 g=34 off=451 692212 GoSysBlock p=3 g=10 off=36153 1127209 GoSysBlock p=0 g=18 off=493 1176512 GoSysExit p=1000003 g=18 off=23689 g=18 seq=6 ts=173541978100972 1200027 GoSysBlock p=2 g=18 off=23707 1591916 GoSysExit p=1000003 g=18 off=12903 g=18 seq=8 ts=173541978123637 1596370 GoSysBlock p=1 g=18 off=12921 18744873 GoSysBlock p=3 g=162 off=40858 34934913 GoSysExit p=1000003 g=162 off=40869 g=162 seq=4 ts=0 On the other hand, the same trace generated with Go1.9, and read with the trace tool on tip shows fewer relevant events. 586130 GoSysBlock p=2 g=10 off=18647 783157 GoSysBlock p=3 g=8 off=27763 787317 GoSysExit p=1000003 g=8 off=27772 g=8 seq=6 ts=0 25363425 GoSysBlock p=1 g=110 off=13369 28141938 GoSysExit p=1000003 g=110 off=13380 g=110 seq=4 ts=0 Looking more carefully about what these goroutine 10 and 34 (whose GoSysBlock events were never paired with GoSysExit events) from the tip trace revealed: they are both runtime.timerproc goroutines. I vaguely remember there were runtime changes related to timer management this cycle. |
Yes. In Go 1.10, there are per-P timer queues as well as a per-P timerproc goroutine CL 34784. That's almost certainly the cause of this. The impact on visualization is a bit unfortunate (and probably worth mentioning in the release notes). Is this actually causing problems, though? |
|
That would explain it, thanks!
The problem I've seen from it is that it makes the visualization less clear. In Go 1.9 and earlier, it was easy to see where a program was saturating the CPU, since there was an indicator (the purple thread ribbon) that would max out at close to 100% of its range. Based on CL 34784, it looks like the ribbon is reflecting reality—but for my uses it's mostly noise now. I was also surprised that I couldn't match up the extra threads to goroutines waiting for syscalls in /debug/pprof/goroutine since they count as system goroutines. The visualization now includes a prominent contribution from a set of goroutines that are very hard to track down. |
|
Interesting. I wonder if we should be hiding or distinguishing threads that are in a system call on behalf of a system goroutine. |
|
Change https://golang.org/cl/81315 mentions this issue: |
The number of threads in syscall presented by execution tracer's
trace view includes not only the threads calling system calls on behalf
of user created goroutines, but also those running on behalf of system
goroutines.

When the number of such system goroutines was small, the graph was
useful when examining where a program was saturating the CPU.
But as more and more system goroutines are invloved the graph became
less useful for the purpose - for example, after golang.org/cl/34784,
the timer goroutines dominate in the graph with large P
because the runtime creates per-P timer goroutines.

This change excludes the threads in syscall on behalf of runtime (system
goroutines) from the visualization. Alternatively, I could visualize the
count of such threads in a separate counter but in the same graph.
Given that many other debug endpoints (e.g. /debug/pprof/goroutine) hide
the system goroutines, including them in the same graph can confuse users.

Update #22574

Change-Id: If758cd6b9ed0596fde9a471e846b93246580b9d5
Reviewed-on: https://go-review.googlesource.com/81315
Reviewed-by: Austin Clements <austin@google.com>
Run-TryBot: Hyang-Ah Hana Kim <hyangah@gmail.com>
TryBot-Result: Gobot Gobot <gobot@golang.org>
|
Is there anything else to do for this issue? |
|
Closing. |
|
Thanks @hyangah . With Below, see the periwinkle band in the Threads ribbon, starting off thick at 0–12ms, waning at 20ms, and close to the expected size around 40ms.
Does the execution trace include the required data at startup or is it only written out as the syscalls return, and does that mean that a timer has to trigger on each P before the Threads ribbon will exclude the timer threads? |

|
Thanks! That's obviously a bug. The tracer processes the sorted event list sequentially, and the GoCreate-GoSysBlock event pairs for pre-existing goroutines are processed before GoStart events that set up the goroutine state (https://go.googlesource.com/go/+/master/src/cmd/trace/trace.go#400). Moreover, GoCreate events (emitted for each goroutine that preexisted when tracing starts) include two stack info (one is where the goroutine is stopped, another is where the GoCreate event logging occurred https://go.googlesource.com/go/+/master/src/runtime/trace.go#214). The later one is less interesting but somehow, the parsed event's stack field is filled that uninteresting one. Anyhow, the information is there for use. I am reopening this issue hoping that it can be addressed soon. |
|
Change https://golang.org/cl/83595 mentions this issue: |
|
@hyangah CL 83595 PS 8 fixes this for me, thanks!
|

What version of Go are you using (
go version)?Does this issue reproduce with the latest release?
The problem is new in tip; go1.9.2 looks fine.
What operating system and processor architecture are you using (
go env)?First seen on linux/amd64 with GOMAXPROCS=36, somewhat reproduced on darwin/amd64 with GOMAXPROCS=8.
What did you do?
I took an execution trace of a server running with Go tip (1ac8846) and compared it to one running go1.9.2. I looked at the "Threads" ribbon near the top of the window.
What did you expect to see?
With go1.9.2, the Threads ribbon shows a very small number of threads in syscall, usually one or two. This makes sense to me: the server handles data over the network so likely has a thread sitting in epoll_wait and occasionally has threads reading and writing to sockets.
What did you see instead?
The Threads ribbon hovers around 37 instead of around 1. My server runs with GOMAXPROCS=36.
I checked /debug/pprof/goroutines?debug=1 and ...?debug=2 to see if there really were more goroutines unexpectedly sitting in syscalls but did not find any.
I've produced a similar behavior on my laptop via
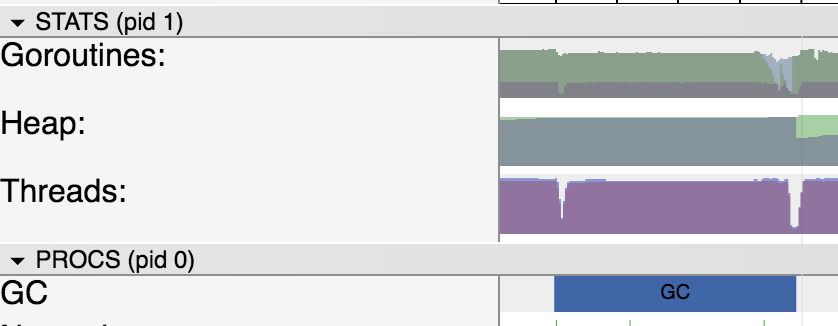
go test net -trace=/tmp/trace && go tool trace /tmp/trace. With go1.9.2 it shows 1 thread in syscall, but on tip it shows 4 threads in syscall.Here's my server with go1.9.2 (linux/amd64, GOMAXPROCS=36):
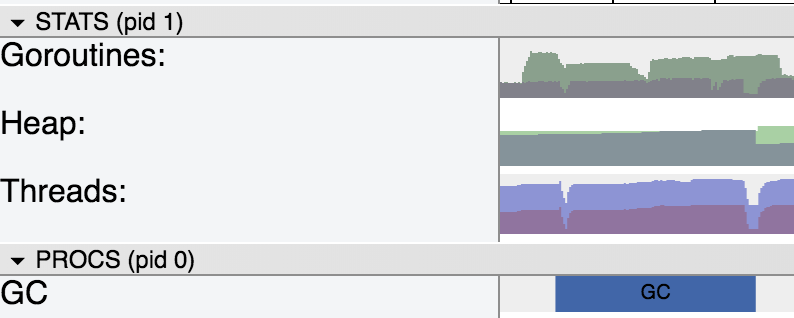
And my server with tip—note the thick layer of periwinkle in the Threads ribbon:
Here's
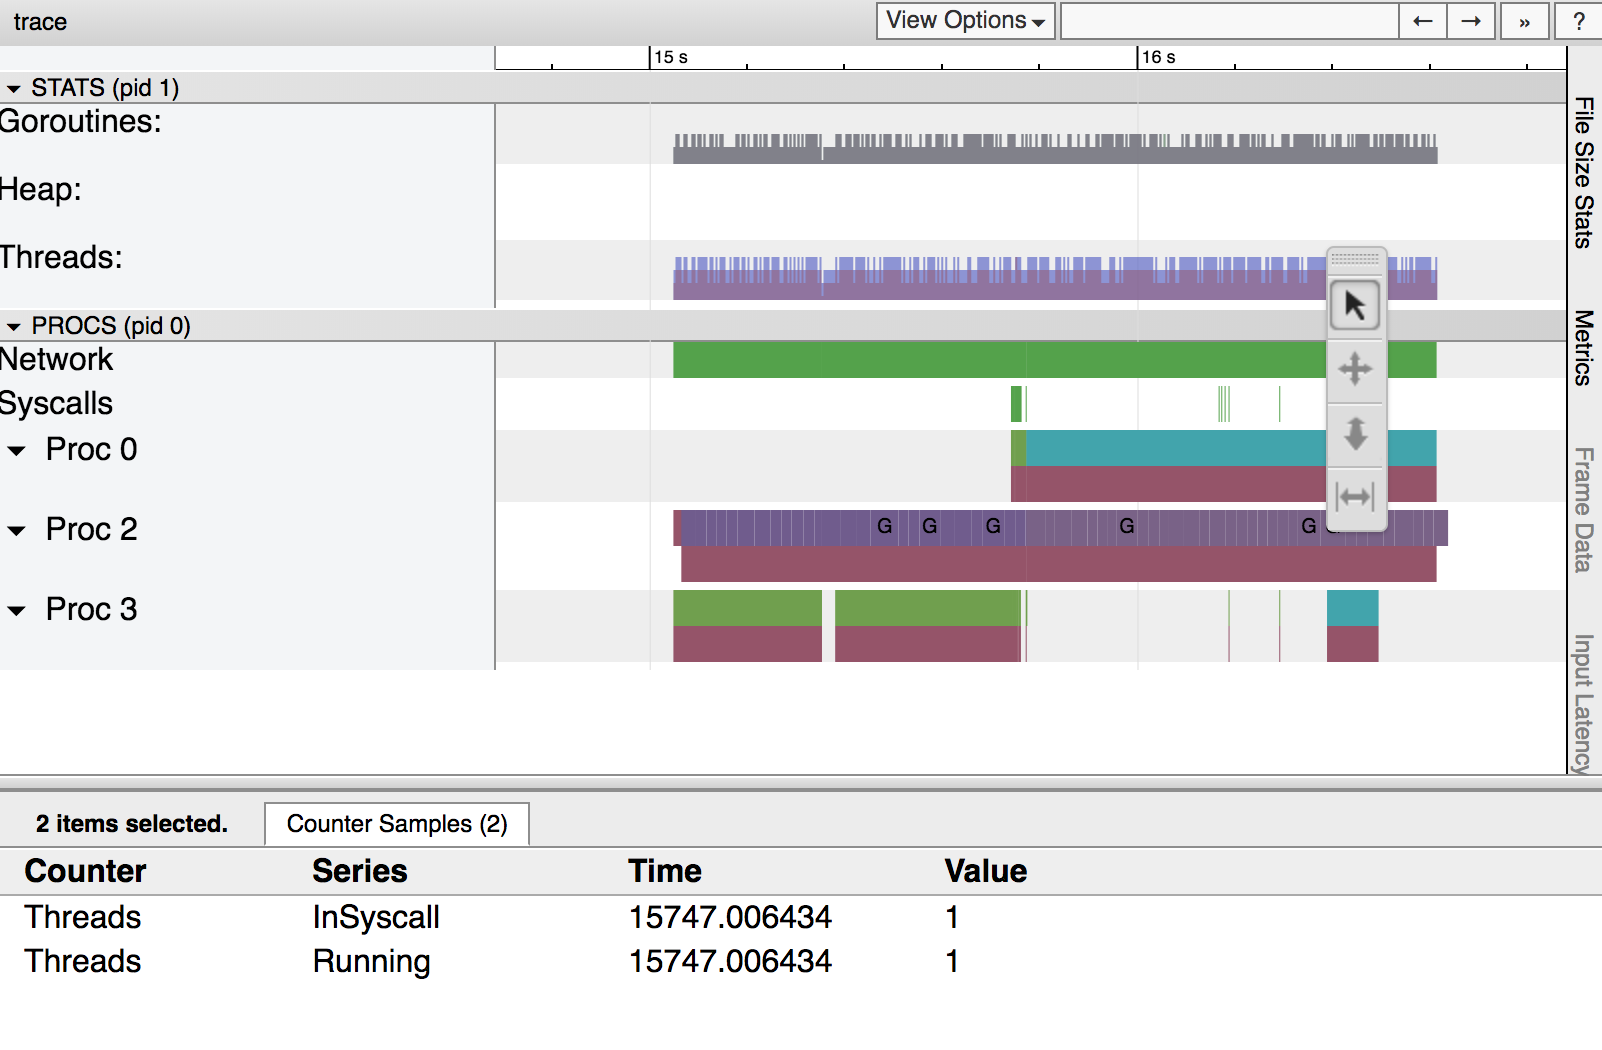
go test netwith go1.9.2 (darwin/amd64, GOMAXPROCS=8):And
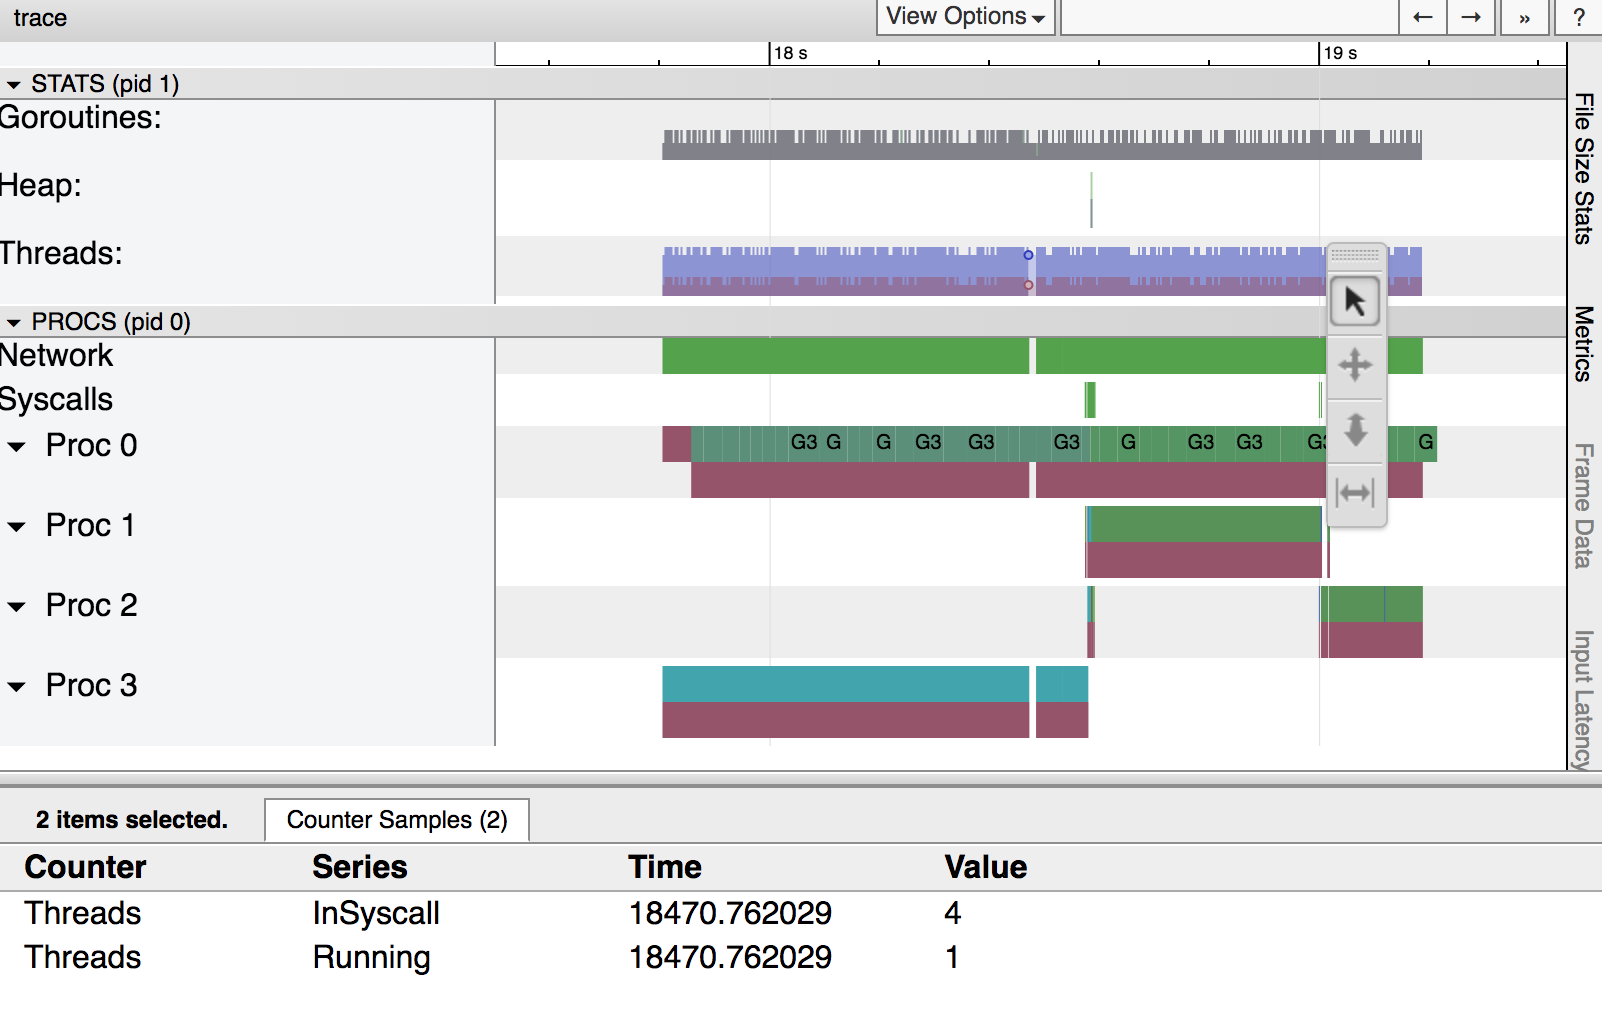
go test netwith tip:The text was updated successfully, but these errors were encountered: