runtime: big performance penalty with runtime.LockOSThread #21827
Comments
|
The kernel scheduler is invoked when 1. an interrupt handler exits (hardware irqs or timer ticks) 2. a syscall exits. 3. the scheduler is explicitly called. Which means the worst-case resolution of scheduling is equal to the resolution of the timer ticks when the system is idle (no irq and no traffic of syscalls). So it's doubtful that the 100us-ish timeout would work as expected when the granularity of the kernel scheduling is much coarse. And if you check out the manpage of futex, it has a sentence about the timeout saying that "This interval will be rounded up to the system clock granularity". That probably explains why the spinlock gets waken up faster. |
|
@typeless futex explicitly calls scheduler, so that's number 3 |
|
I don't think this affects cgo calls, notesleep should not be on fast path there. |
But for the user process being able to call the scheduler, doesn't the process have to be invoked by the scheduler first? |
|
If it's not running, it won't be able to set |
|
Apologies for my ambiguous wording. By processes I actually mean the OS threads.
Isn't it possible that a running thread being interrupted and yield the CPU to others temporarily (unless it can disable the IRQs)? The timing that the thread gets rescheduled again can only be the next scheduling points, which is beyond the control of the thread. P.S. FWIW a possible way to occupy the CPU exclusively other than disabling the IRQs is to use sched_setscheduler for the SCHD_FIFO policy. |
@dvyukov original benchmark uses only CGo calls without CGo callbacks. lockOSThread is used on cgocall fast path for every CGo call: https://github.com/golang/go/blob/ab401077/src/runtime/cgocall.go#L107 and somehow, as benchmark shows, it gets intermixed with the scheduler: |
|
@typeless sorry, I don't see how this is related the topic. |
What is the result if you comment out lockOSThread/unlockOSThread in cgocall (it's not really needed there)? |
|
@dvyukov thanks for the question, I too thought about it just after commenting. So on today's unmodified tip (go version devel +c2f8ed267b Wed Sep 13 07:19:21 2017 +0000 linux/amd64) it gives: with adding diff --git a/src/runtime/cgocall.go b/src/runtime/cgocall.go
index ce4d707e06..decc310088 100644
--- a/src/runtime/cgocall.go
+++ b/src/runtime/cgocall.go
@@ -106,7 +106,7 @@ func cgocall(fn, arg unsafe.Pointer) int32 {
// Lock g to m to ensure we stay on the same stack if we do a
// cgo callback. In case of panic, unwindm calls endcgo.
- lockOSThread()
+// lockOSThread()
mp := getg().m
mp.ncgocall++
mp.ncgo++
@@ -159,7 +159,7 @@ func endcgo(mp *m) {
raceacquire(unsafe.Pointer(&racecgosync))
}
- unlockOSThread() // invalidates mp
+// unlockOSThread() // invalidates mp
}
// Call from C back to Go.it becomes: with adding notesleep spin patch on top (so both cgocall and notesleep are patched) it becomes: which shows the speedup is not only related to lockOSThread and somehow generally (?) applies to scheduler or some other details of CGo calls. |
This makes sense now. I guess it is general tradeoff between latency and burning CPU. |
|
If in cgocall I also disable entersyscall/exitsyscall even without notesleep spin patch, so whole patch is below: diff --git a/src/runtime/cgocall.go b/src/runtime/cgocall.go
index ce4d707e06..70fbe7e7b1 100644
--- a/src/runtime/cgocall.go
+++ b/src/runtime/cgocall.go
@@ -106,7 +106,7 @@ func cgocall(fn, arg unsafe.Pointer) int32 {
// Lock g to m to ensure we stay on the same stack if we do a
// cgo callback. In case of panic, unwindm calls endcgo.
- lockOSThread()
+// lockOSThread()
mp := getg().m
mp.ncgocall++
mp.ncgo++
@@ -129,9 +129,9 @@ func cgocall(fn, arg unsafe.Pointer) int32 {
// "system call", run the Go code (which may grow the stack),
// and then re-enter the "system call" reusing the PC and SP
// saved by entersyscall here.
- entersyscall(0)
+// entersyscall(0)
errno := asmcgocall(fn, arg)
- exitsyscall(0)
+// exitsyscall(0)
// From the garbage collector's perspective, time can move
// backwards in the sequence above. If there's a callback into
@@ -159,7 +159,7 @@ func endcgo(mp *m) {
raceacquire(unsafe.Pointer(&racecgosync))
}
- unlockOSThread() // invalidates mp
+// unlockOSThread() // invalidates mp
}
// Call from C back to Go.compared to only lockOSThread commented it becomes: And if I comment only syscallenter/syscallexit, so whole patch is: diff --git a/src/runtime/cgocall.go b/src/runtime/cgocall.go
index ce4d707e06..243688f0af 100644
--- a/src/runtime/cgocall.go
+++ b/src/runtime/cgocall.go
@@ -129,9 +129,9 @@ func cgocall(fn, arg unsafe.Pointer) int32 {
// "system call", run the Go code (which may grow the stack),
// and then re-enter the "system call" reusing the PC and SP
// saved by entersyscall here.
- entersyscall(0)
+// entersyscall(0)
errno := asmcgocall(fn, arg)
- exitsyscall(0)
+// exitsyscall(0)
// From the garbage collector's perspective, time can move
// backwards in the sequence above. If there's a callback intocompared to unmodified tip it becomes: so in case of CGo calls the notesleep spin patch brings speedup not becuase of lockOSThread but due to entersyscall/exitsyscall being there. |
|
Yes, entersyscall/exitsyscall is what interacts with Go scheduler in case of cgo calls. |
I generally agree but some kind of adaptive spinning could be brought to notesleep/notewakeup too - 4e5086b9#diff-608e335144c55dc824f257f5a66ac4d3R125 becuase currently notesleep always unconditionally goes directly to sys_futex to kernel. |
|
And by the way - many fast syscalls is not synthetic benchmark - they appear in real programs either reading fast from cached files or sending/receiving on network (yes network is epolled but still every send/recv goes through full - not raw - syscall). In my experience every such event has potential to shake the scheduler. |
|
notesleep is not meant for sleeping for brief periods. There are callers for which spinning will be plain harmful. mutex is meant for brief blocking. |
|
Thanks for feedback. I understand there is difference between notesleep and mutex and notesleep by definition is more heavier sleep. With this in mind and adjusted patch: diff --git a/src/runtime/lock_futex.go b/src/runtime/lock_futex.go
index 9d55bd129c..5648ef66f3 100644
--- a/src/runtime/lock_futex.go
+++ b/src/runtime/lock_futex.go
@@ -146,7 +146,14 @@ func notesleep(n *note) {
// Sleep for an arbitrary-but-moderate interval to poll libc interceptors.
ns = 10e6
}
- for atomic.Load(key32(&n.key)) == 0 {
+ for spin := 0; atomic.Load(key32(&n.key)) == 0; spin++ {
+ // spin a bit hoping we'll get wakup soon hopefully without context switch
+ if spin < 10 {
+ osyield()
+ continue
+ }
+
+ // no luck -> go to sleep heavily to kernel; this might result in context switch
gp.m.blocked = true
futexsleep(key32(&n.key), 0, ns)
if *cgo_yield != nil {it still works for both LockOSThread and CGo cases: but the spinning now does not wastefully burn CPU and gives up to OS scheduler via osyield(). This works similarly to "passive spinning" phase of mutex lock. For mutex the N(passive-spin) = 1 and since notesleep is more heavier having N(passive-spin) for it an order of magnitude more seems logical. The osyield will release the CPU to other threads if there is other work to do and thus hopefully should not have negative impact (this has to be verified).
Maybe you are right here. I will try to reverify this once getting to a related topic and will hopefully come back with feedback. |
|
@dvyukov, could you please clear up that
bit for me? Do I parse it correctly, that network syscalls are treated specially and P is not removed from under a G which spends more than 20 us in such a syscall, like this is done for all other syscalls? Or does this merely happen "all by itself" — as a byproduct of such syscalls commonly lasting only about 5 us (thanks to the sockets being non-blocking)? |
|
It happens for all syscalls/cgocalls if they return faster than 20us. |
This is still wasteful for some callers. What exactly caller of notesleep is affected by this change? Can we improve the caller instead? |


|
Btw, do you have particular example where osyielding in notesleep will be wasteful? (go scheduler is new to me) |
|
I would try spinning in findrunnable more, before dropping P, that can yield better result without impacting other cases. Re stoplockedm, I am still not sure. We could also spin there before dropping P, but then this is an optimization for the case when a locked G in unblocked very quickly. It's unclear how often this happens in real life, and even if it does happen it still won't be fast because of the required thread jumps. But this will hurt other goroutines because we are holding the P. If you care about performance of locked goroutines, there seems to be a bunch of other missed optimizations. E.g. when a locked G is woken, we wake another M, but that M cannot execute the G, so it wakes the right M and passes G/P to it. I guess we need to wake the right M right away. |
|
@dvyukov thanks for your feedback with knowledge sharing - it is appreciated. My situation is this: I have a case where my server is misperforming because of, I think, go scheduler (tracing shows many spawned goroutines are queued to same P and are not stealed while I need all them to execute in parallel to significantly reduce latency; other Ps are idle) . There I do not use LockOSThread and CGo at all at the moment. I cannot even describe the problem properly yet because it has not been fully analyzed yet. I spent some time learning how go scheduler works to better understand what happens when a goroutine is started, channel sent/received etc. Along the way I did a quick tool to profile how often goroutines are migrated in between Ms: https://lab.nexedi.com/kirr/neo/blob/851864a9/go/gmigrate.go because unfortunately it seems to be a frequent event and changing M probably means changing CPU and thus loosing CPU caches. After studying I quickly looked around for scheduler bugs here on issue tracker and found LockOSThread case. I tried to test whether I understood at least something via trying to fix it, and so we are here. So if someone else does not fix the LockOSThread and CGo cases before me, I will hopefully try to give it a fresh look while working on my scheduler-related issues. However scheduler bits are currently lower priority for me compared to proper memory and other tuning - so it will be some time before I could dig in more details on this topic. Thanks again for feedback and appologize for throttling, |
Sounds pretty bad. But does not look like an issue with notesleep. |
|
Could this be a co-tenancy issue? Are there other processes running at the
same time the go process is running? If so has GOMAXPROCS been adjusted
accordingly?
And as Dmitry said a reproducer would be great, if not then a trace so we
can see why goroutines aren't being stolen.
…On Wed, Sep 13, 2017 at 8:25 AM, Dmitry Vyukov ***@***.***> wrote:
tracing shows many spawned goroutines are queued to same P and are not
stealed while I need all them to execute in parallel to significantly
reduce latency; other Ps are idle
Sounds pretty bad. But does not look like an issue with notesleep.
Repro would be useful (and/or trace file).
—
You are receiving this because you are subscribed to this thread.
Reply to this email directly, view it on GitHub
<#21827 (comment)>, or mute
the thread
<https://github.com/notifications/unsubscribe-auth/AA7Wn1RnzSJ2SK9i4WejD5HFv_O4k6AJks5sh8nJgaJpZM4PST4g>
.
|
|
It is running on my notebook which has 4 CPU (2 physical * 2 HT). There are 2 programs: server + client. The client tries to issue 512 simultaneous networking requests over same TCP connection to server and then waits for completion, but from what I recall even initiating them go mostly serially. GOMAXPROCS is unadjusted and default to ncpu=4. No other program significantly uses the processor. I admit networking over loopback is not the same as networking on LAN (on LAN RTT ~= 500μs while for TCP/loopback and separate processes it is aroung 5-8μs). We do care about loopback case too though. I promise I get back to this once dealing with other urgent tunings. Probably in a week or two. |
|
I generally agree that what @dvyukov suggests should be the way to go, not my silly spinning patch. |
disable a bunch of necessary stuff to benchmark conditional breakpoints

also ugly hack to run all of proc.Continue code inside the ptrace thread

golang/go#21827
|
Guys any update on this issue? |
|
@omriperi Many programs and libraries use |
|
I can only restate that the benchmark is not synthetic: #21827 (comment). |
|
My apologies. It would help a great deal if you could share the real code, so that we can understand the real problem. |
|
I apologize as well as I don't actively work on this topic now (the issue is from 2017), and cannot provide "the real code". However I clearly remember that scheduler performance issues start to show in practically all scenarious where either many system calls or Cgo calls are made. My understanding is that LockOSThread only brings those performance issues more to the surface. Here are some evidence, from what I could remember, to justify my words: #19574 Many projects switch off from using Go for this reason: In the end, only the code that does not push this pain points stay with Go, and due to that there might be impression that there are no real scheduler/Cgo/LockOSThread performance problems... |
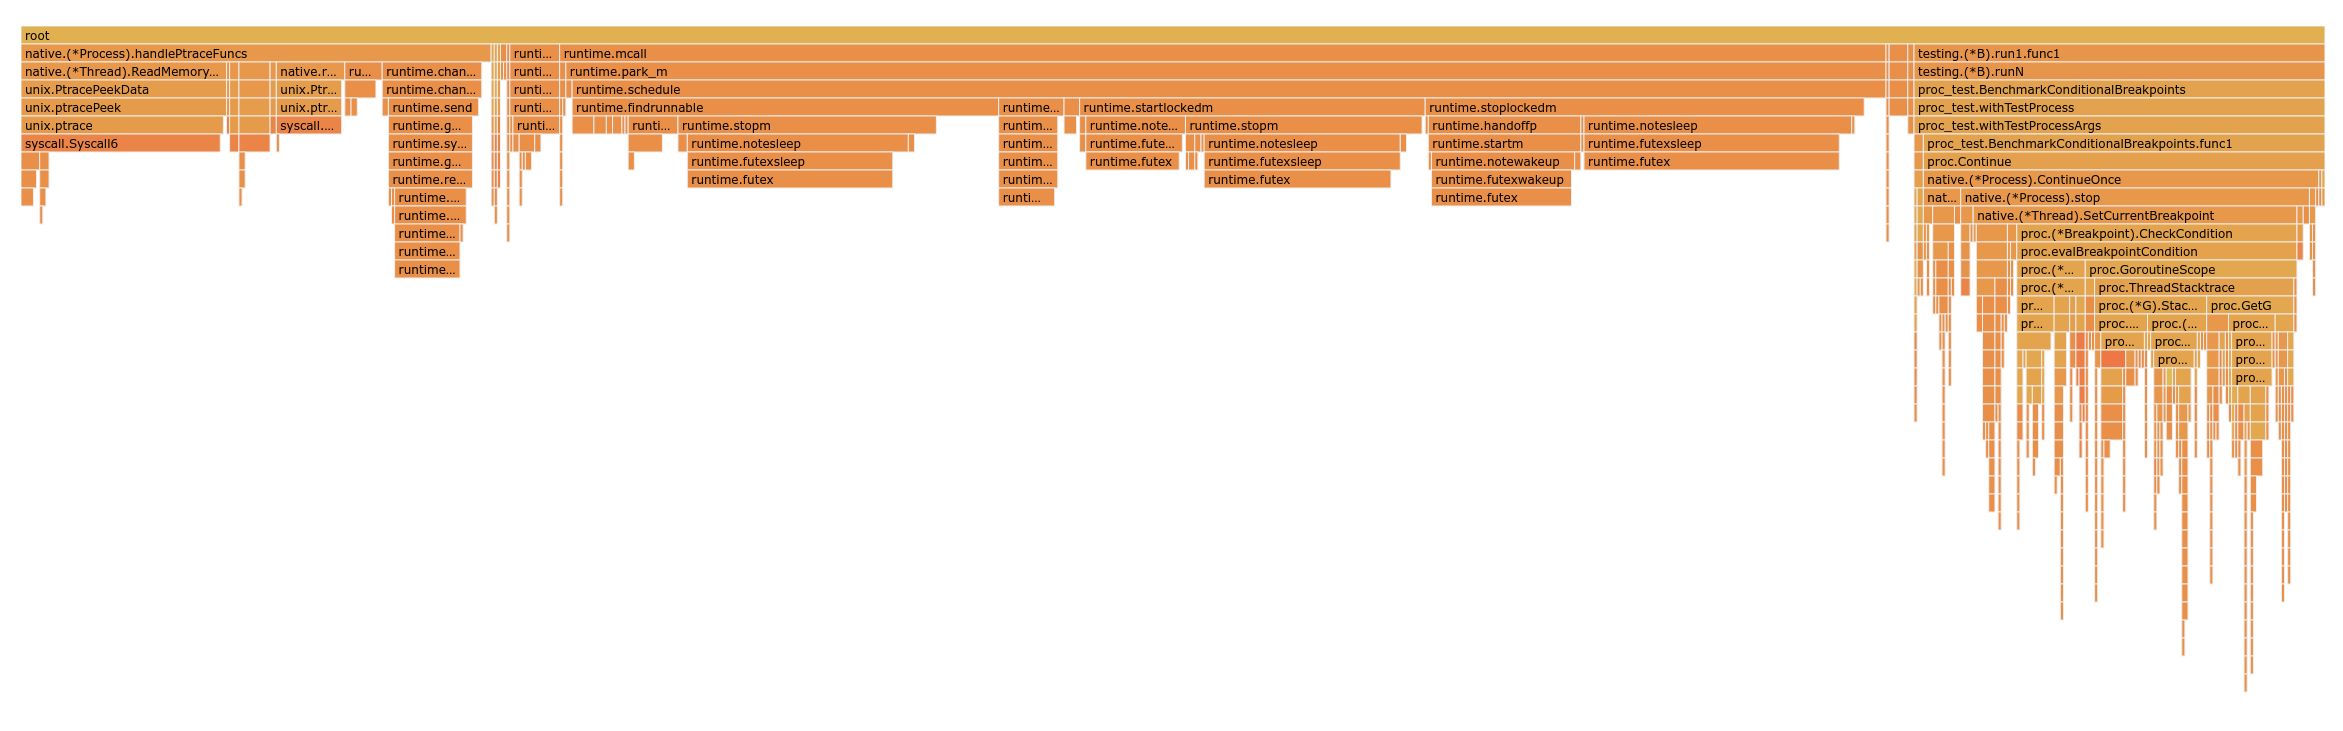
I've recently discovered that this problem affects Delve, for example. Debugger-related calls (ptrace on linux, WaitForDebugEvent/ContinueDebugEvent on windows) need to be done on the same thread as the thread that spawned the target process, for this we use a goroutine that calls runtime.LockOSThread and executes thunks sent to it through a channel. The code for this is in https://github.com/go-delve/delve/blob/f863be0a172a9c62d679143ec53587ef6255737e/pkg/proc/native/proc.go#L348 which is pretty much identical to the set up in this issue. Back in january I looked into optimizing the performance of conditional breakpoint evaluation. There were several performance problems on our side (note: not all have landed upstream yet), when those were taken care the flame graph looked like this:
which shows that a lot of our time was spent inside runtime.findrunnnable. By simply moving all the code inside the LockOSThread goroutine I can get this flame graph:
the LockOSThread thing is responsible for 2/3 of the time it takes to evaluate a conditional breakpoint (specifically 0.4ms out of 0.6ms). |

|
@navytux There is a big difference between cgo overhead, which has gotten somewhat better, and |
|
@ianlancetaylor, I wrote #21827 (comment) with full understanding that Anyway, whatever it is, e.g. Delve case (#21827 (comment); thanks @aarzilli) demonstrates this issue on a real-world program. |
|
I recently hit this problem working with GLFW/OpenGL based frameworks. I found a relatively simple program was consuming huge amount of CPU, >50% via Go packages commonly use a channel to pass functions that must be executed on the main thread (GLFW/GL requirement). Eg, This cut down example demonstrates the technique, and the kind of CPU profiles it generates: package main
import (
"fmt"
"os"
"runtime"
"runtime/pprof"
"time"
)
const iterations = 1e6
func main() {
runtime.LockOSThread()
f, _ := os.Create("cpu.prof")
defer f.Close()
_ = pprof.StartCPUProfile(f)
defer pprof.StopCPUProfile()
// Increasing chan size significantly improves performance when
// not waiting for completion (keeps the main thread busy).
calls := make(chan func(), 1)
go func() {
for i := 0; i < iterations; i++ {
done := make(chan struct{})
calls <- func() {
close(done)
}
<-done // Comment to reduce parking main thread.
}
close(calls)
}()
// Process calls on the "main" thread.
t0 := time.Now()
for fn := range calls {
fn()
}
fmt.Println("Mean:", time.Since(t0)/iterations)
} |
|
@mpx @ianlancetaylor Why is this a problem at all? The doc clearly states that LockOSThread causes a single goroutine to be run exclusively on a single thread. This naturally implies that communication via channels (or whatever) will cross thread boundaries, therefore requires locking/context switch & causes overhead. This seems totally reasonable. @mpx It is true, that graphics stacks require you to use LockOSThread due to thread-local storage often used in old & rotten C libraries. However, passing callbacks from other goroutines usually work differently. You use a locked slice of callbacks and simply queue them. In the render loop you simply check every frame if there are callbacks and run them. If not, wait until the next frame. In this case, there is less chance of lock contention and park & wake-up. Also, your problem is totally not related to Go. As soon as you start using multiple threads, even in C/C++, you need a way of syncing the main render loop. @navytux Maybe it would be helpful to summarize the initial problem more clearly? |
|
@chrisprobst This issue is about speeding up a specific case, for which a reduced test case appears in the initial comment. I agree that using |
|
Change https://go.dev/cl/562915 mentions this issue: |
I would like have this version like "unsafecgo call" - use unly lock thread ... |
This issue reopens #18023.
There it was observed that if a server goroutine is locked to OS thread, such locking imposes big performance penalty compared to the same server code but without handler being locked to OS thread. Relevant golang-nuts thread discusses this and notes that for case when runtime.LockOSThread was used the number of context switches is 10x (ten times, not 1000x times) more compared to the case without OS thread locking. #18023 (comment) notices the context switch can happen because e.g.
futex_wake()in kernel can move woken process to a different CPU.More, it was found that essentially at every CGo call lockOSThread is used internally by Go runtime:
https://github.com/golang/go/blob/ab401077/src/runtime/cgocall.go#L107
so even if user code does not use LockOSThread, but uses CGo calls on server side, there are preconditions to presume similar kind of slowdown.
With above in mind #18023 (comment) shows a dirty patch that spins a bit in
notesleep()before going to kernel tofutex_wait(). This way it is shown that 1) large fraction of performance penalty related to LockOSThread can go away, and 2) the case of CGo calls on server can also receive visible speedup:The patch is for sure not completely right (and probably far away from being right) as always spinning unconditionally should sometimes bring harm instead of good. But it shows that with proper scheduler tuning it is possible to avoid context switches and perform better.
I attach my original post here for completeness.
Thanks,
Kirill
/cc @rsc, @ianlancetaylor, @dvyukov, @aclements, @bcmills
#18023 (comment):
Let me chime in a bit. On Linux the context switch can happen, if my reading of futex_wake() is correct (which is probably not), because e.g. wake_up_q() via calling
wake_up_process()-> try_to_wake_up() -> select_task_rq() can select another cpufor woken process.
The Go runtime calls
futex_wake()in notewakeup() to wake up an M that was previously stopped via stopm() -> notesleep() (the latter callsfutexwait()).When LockOSThread is used an M is dedicated to G so when that G blocks, e.g. on chan send, that M, if I undestand correctly, has high chances to stop. And if it stops it goes to
futexwaitand then context switch happens when someone wakes it up because e.g. something was sent to the G via channel.With this thinking the following patch:
makes BenchmarkLocked much faster on my computer:
I also looked around and found: essentially at every CGo call lockOSThread is used:
https://github.com/golang/go/blob/ab401077/src/runtime/cgocall.go#L107
With this in mind I modified the benchmark a bit so that no LockOSThread is explicitly used, but server performs 1 and 10 simple C calls for every request:
which shows the change brings quite visible speedup.
This way I'm not saying my patch is right, but at least it shows that much can be improved. So I suggest to reopen the issue.
Thanks beforehand,
Kirill
/cc @dvyukov, @aclements, @bcmills
full benchmark source:
(
tmp_test.go)(
tmp.go)The text was updated successfully, but these errors were encountered: